Forex Analysis Of USD/JPY For Tuesday, August 14
First, we look into the previous day trade and what happened on August 13, 2018, and the USD/JPY pair opened at 110.445 and went high at 110.906 and gone low 110.125 and finally closed at 110.628. The calculated pivot point for the day is 110.553.
The difference between high and low was nearly 0.781 points and there was a very good chance for traders to take the opportunity between low to high levels and finally benefit.
The pair is going to high levels from support levels and traders should be cautious since it reached the overbought region and they should buy at the support levels for more profits. Four-hour chart followers may consider buy at 110.878, 111.481 and sell at 110.509, 109.790 levels.
LEVELS TO BE WATCHED FOR TRADERS FOR THEIR TRADING
|
Level |
First Level |
Second Level |
Third Level |
|
Selling Level |
110.00 |
109.70 |
209.40 |
|
Buying Level |
111.20 |
111.50 |
111.80 |
EVENTS TO BE OBSERVED AT THESE TIMES TO TAKE MORE ADVANTAGE
USDJPY FUNDAMENTALS TODAY
|
GMT |
Event |
Actual |
Previous |
|---|---|---|---|
|
04:30 |
JPY Capacity Utilization |
-2.2% |
-2.1% |
|
04:30 |
JPY Industrial Production (MoM) |
-1.8% |
-2.1% |
|
04:30 |
JPY Industrial Production (YoY) |
-0.9% |
-1.2% |
|
10:00 |
USD NFIB Business Optimism Index |
107.9 |
107.2 |
|
12:30 |
USD Export Price Index (YoY) |
5.3% |
|
|
12:30 |
USD Import Price Index (MoM) |
-0.4% |
|
|
12:30 |
USD Export Price Index (MoM) |
0.3% |
|
|
12:30 |
USD Import Price Index (YoY) |
4.3% |
|
|
12:55 |
USD Redbook index (MoM) |
0.9% |
|
|
12:55 |
USD Redbook index (YoY) |
5.6% |
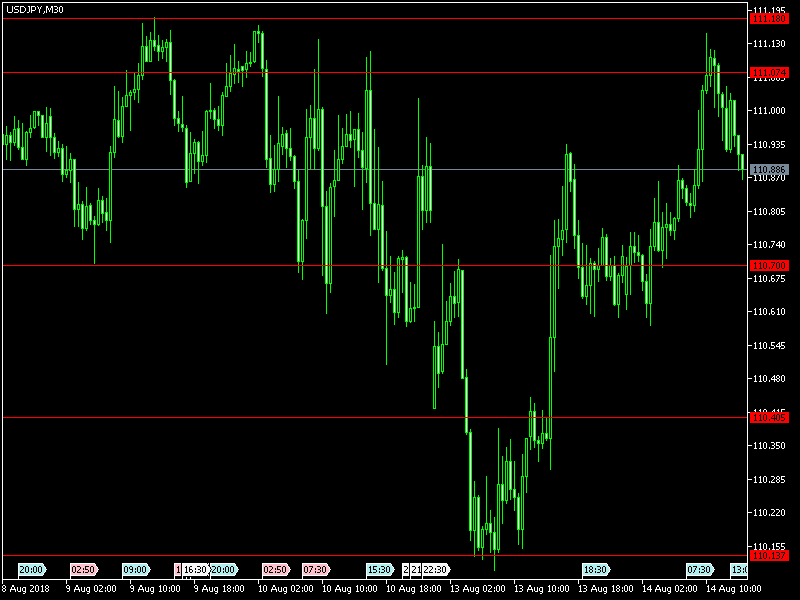
See the levels in the Chart and trade accordingly:
(Click on image to enlarge)