
FOMC Likely To Soften Tone/Language, Watch Out If Stocks Cannot Rally On This
The FOMC meets this week. A 25-basis-point hike is expected, so is a shift to a dovish bias. Watch out if stocks, beaten up the past two and a half months, cannot rally on this, and/or shorts quickly show up at broken support after a relief rally.
On October 3, the S&P 500 large cap index began retreating from an intraday high of 2939.86 what soon turned into a waterfall dive (Chart 1). Through last Monday’s intraday low of 2583.23, it fell 12.1 percent.
October 3 was also when Jerome Powell, Fed chair, said interest rates were still “a long way” from neutral, suggesting continued hawkish bias in the weeks/months ahead. US equities, which until then had taken the Fed’s tightening campaign in stride, began to fear continued tightening, and began to puke.
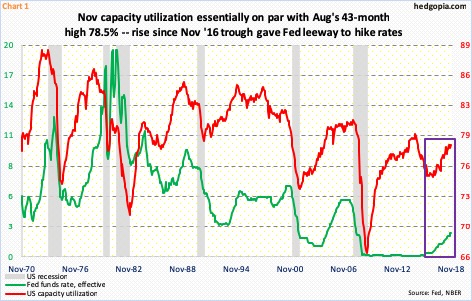
Since December 2015, the fed funds rate has gone up by 200 basis points to a range of 200 to 225 basis points. For the last time this year, the FOMC meets this week (18-19), and a 25-basis-point raise is pretty much priced in, with 77-percent odds in the futures market. The dot plot expects three more hikes next year. Equities thus began to worry what credit had been warning all along – can the economy handle all this tightening?
For instance, US capacity utilization came in at 78.5 percent in November, essentially tying August’s 43-month high. The sideways action the last four months comes after rising 3.5 percentage points since the cyclical low in November last year. The cycle high was recorded back in November 2014 when utilization peaked at 79.6 percent. Unlike past cycles, it is yet to cross 80 percent, and likely does not happen (Chart 1).
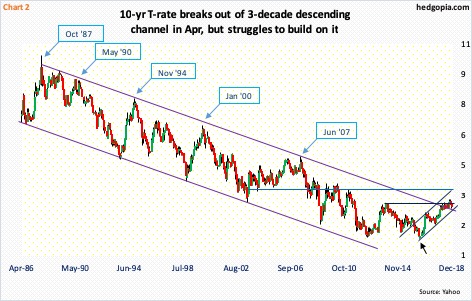
Throughout the Fed’s tightening campaign over the past three years, the long end of the Treasury yield curve never followed short rates higher in earnest. The 10-year yield has risen since bottoming at 1.34 percent in July 2016 (arrow in Chart 2). Most recently, it bottomed at 2.03 percent in September last year, before proceeding to break out of three percent in April this year. This is about where it also broke out of a three-decade-old descending channel.
But the rally stopped early October, peaking at 3.25 percent on the 5th. On November 8, it unsuccessfully tested that high, rising to 3.24 percent, before coming under pressure. Last Monday, it hit a low of 2.83 percent. In the meantime, the two-year yield, which tends to be sensitive to market’s expectation of the Fed’s monetary policy, rallied all the way to 2.97 percent on November 8; it closed Friday at 2.74 percent.
Since the Fed started raising rates in December 2015 after leaving them zero-bound for seven long years, the yield spread between the two- and 10-year has narrowed from 137 basis points to 16 basis points. Twice this month, the spread dipped as low as 11 basis points. Bond vigilantes are worried – increasingly so. Equities are joining credit.
This week, as the FOMC meeting concludes, rates-fearing equity bulls in all likelihood will have an opportunity to breathe a sigh of relief. On November 28, Powell in a speech said interest rates were “just below” neutral. This was a U-turn for him, versus what he said on October 3. Not much changed between October 3 and November 28. On the macro front, most data had already been softening. The difference between those two dates were (1) stocks began selling off, and (2) the yield curve kept flattening.
In October-November and December-to-date, equity bulls got gored. A lot, therefore, rides on this week. It is probable on Wednesday, Powell will confirm his dovish switch. Stocks should be able to rally on this. Bulls’ worst nightmare is if the opposite occurs, that is if stocks are unable to rally and/or if in the event of a rally shorts quickly show up at broken-support-turned-resistance.
Here are some levels worth watching.
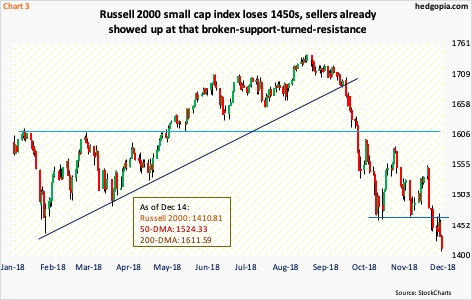
Of the major US equity indices, the Russell 2000 small cap index (1410.81) acts the weakest. During the October rout, it lost major support just north of 1600, followed by persistent lower highs. During all this, small-cap bulls defended the 1450s – until six sessions ago when it gave way. Several times last week, bears showed up at that support-turned-resistance, which is the one to watch now. From bulls’ perspective, the sooner this level is recaptured, the better.
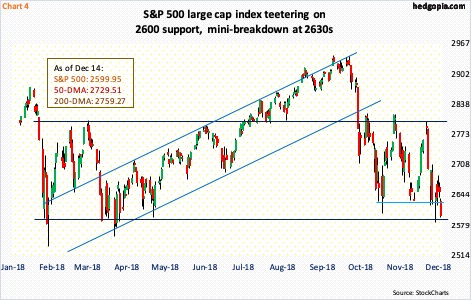
There is a similar risk building on the S&P 500 (2599.95).
The selloff in October stopped later that month when bulls defended 2600. The subsequent rally stopped at 2800, which since February this year has proven to be an important level. Bulls again showed up just north of 2600 in November, and once again the subsequent rally was met with selling at 2800. Before this, 2600 was last hit during February and April this year.
Last Friday, the S&P 500 literally closed on that support. Bulls obviously do not want to see a genuine breach. Even if things stabilize here and a rally follows, shorts can reappear at the 2630s, where a mini-breakdown occurred last Friday (Chart 4). That is the risk, hence worth watching.
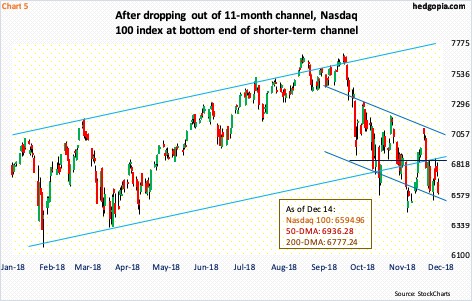
Over on the Nasdaq 100 index (6594.96), there is a tug of war between monthly and weekly momentum indicators. If the former prevails, the index can go a lot lower. If the weekly wins out, there is room for it to rally.
Thus far, bulls have done a decent job of defending 6600. This level also approximates the lower bound of a short-term descending channel (Chart 5). In the event of a rally, nearest resistance lies at 6850, which is also where the underside of a broken months-long ascending channel lies. After that lies 7100, which approximates the 200-day (7073.83).
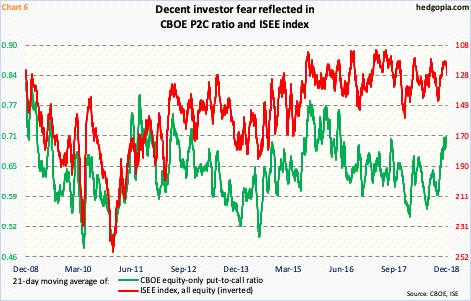
If shorts continue to prevail in the sessions ahead or quickly show up after a relief rally at/near the afore-mentioned levels, the 21-day moving average of the CBOE equity-only put-to-call ratio could very well be headed toward the mid-0.70s, which is where it peaked in February 2016, when the S&P 500, and US stocks in general, reached a major bottom.
The ratio closed last Friday at 0.707, after having risen to 0.710 Tuesday. This is already a level showing a decent amount of investor fear. In fact, the 21-day moving average of the ISEE index acts a lot more panicky, and has begun to rise, with Friday at 126.3 versus 119.2 on the 6th. This is a call-to-put ratio, hence inverted in Chart 6. Whether it continues to unwind or reverts lower depends a lot on how traders perceive what the FOMC gives mid-week.
Disclaimer: This article is not intended to be, nor shall it be construed as, investment advice. Neither the information nor any opinion expressed here constitutes an offer to buy or sell any ...
more

