
First Business Financial Services - Barchart's Chart Of The Day
The Chart of the Day is First Business Financial Services (FBIZ). I found the stock by sorting the All Time High list for new high frequency in the last month. I skipped the stocks that didn't have positive gains in the last week and month, then used the Flipchart feature to review the charts.
First Business Financial Services is the parent of the First Business family of companies, managing shareholder relations and providing access to capital for our operating entities. It provides its subsidiaries with cost-effective corporate services including human resources, finance, information technology, and marketing. Its companies include First Business Bank, First Business Bank - Milwaukee, First Business Trust & Investments, First Business Leasing, LLC, and First Business Capital Corp.
Barchart's Opinion trading systems are listed below. Please note that the Barchart Opinion indicators are updated live during the session every 10 minutes and can therefore change during the day as the market fluctuates. The indicator numbers shown below therefore may not match what you see live on the Barchart.com web site when you read this report.
Barchart technical indicators:
- 96% Barchart technical buy signals
- Trend Spotter buy signal
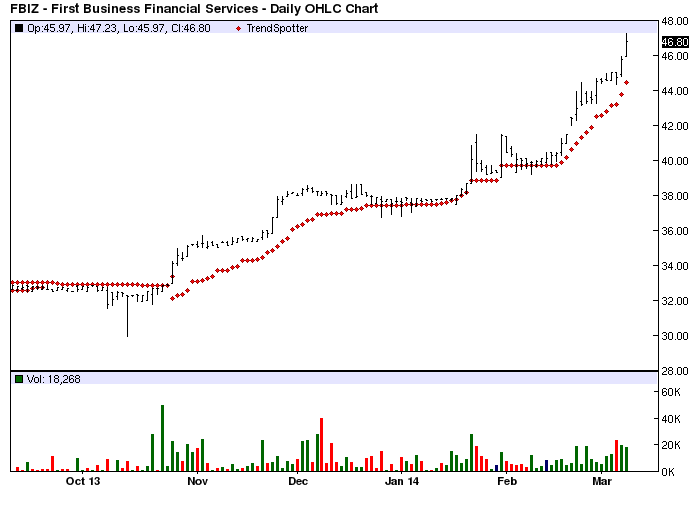
- Above its 20, 50 and 100 day moving averages
- 16 new highs and up 17.32% in the last month
- Relative Strength Index 88.28%
- Barchart computes a technical support level at 45.41
- Recently traded at 46.80 with a 50 day moving average of 40.29
Fundamental factors:
- Market Cap $183.46
- P/E 12.82
- Dividend yield 1.88%
- Revenue predicted to grow 5.90% this year and another 5.00% next year
- Earnings estimated to increase 6.30% this year, an additional 6.50% next year and continue to increase at an annual rate of 5.00% for the next 5 years
- Wall Street analysts issued 1 strong buy and 2 buy recommendations on the stock
- Financial Strength is B
Solid increases in both revenue and earnings should mean increase in price. Watch the 50 day moving average for momentum weakness and use the 100 day moving average for an exit point.
None.


