
Financial Markets Keep Swinging At The Rhythm Of History - Part 2
<< Read More: An Indicator That Assesses Which S&P 500 Sectors Are Likely To Outperform - Part 1
In the article An Indicator That Assesses Which S&P 500 Sectors Are Likely To Outperform of February 9, 2021, I reviewed what happens to the 11 sectors of the S&P 500 during several business cycles. The following is an update to the forecasts made in that article. It is a way to verify the validity of the ideas presented at that time.
Business activity does not expand on a straight line. Business grows in cycles because managers find it difficult to assess demand for their products. As a result, they create imbalances in the financial markets with their decisions to keep the appropriate levels of inventories.
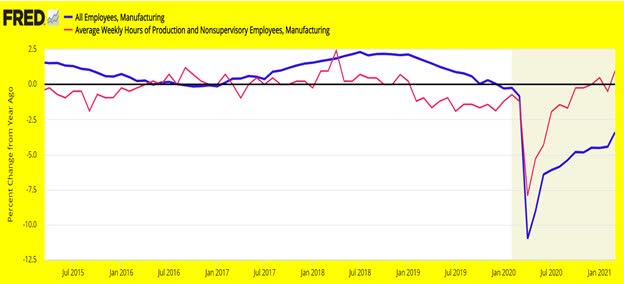
Source: St. Louis Fed
The above chart shows the trajectory of the previous business cycle (2016-2020) and the new cycle started in March 2020. The growth in manufacturing employment (blue line) is an excellent way to visualize the business cycle. It bottomed in 2016, peaked in 2018, and bottomed again in March 2020. The average workweek (red line) is an added indicator leading employment by several months.
In a recovering economy, business, not confident the bottom of the cycle has been reached, tries to extend the workweek rather than hiring new workers (see, for instance, the 2015-2016 episode on the chart). Right now, the average workweek is being extended, a sign business is experiencing a strong economy, suggesting further improvements in manufacturing employment.
The point is these data show an expanding economy. Several indicators reviewed in my previous articles suggested the business cycle was on an upswing. Since March 2020, business has been facing a serious decline in inventories due to the pandemic.
Since then, it kept increasing production to replenish depleted inventories. Managers aggressively had to purchase raw materials, hire new workers, and borrow more money. The outcome has been rising commodities, rising employment in manufacturing, and rising interest rates.
(Click on image to enlarge)
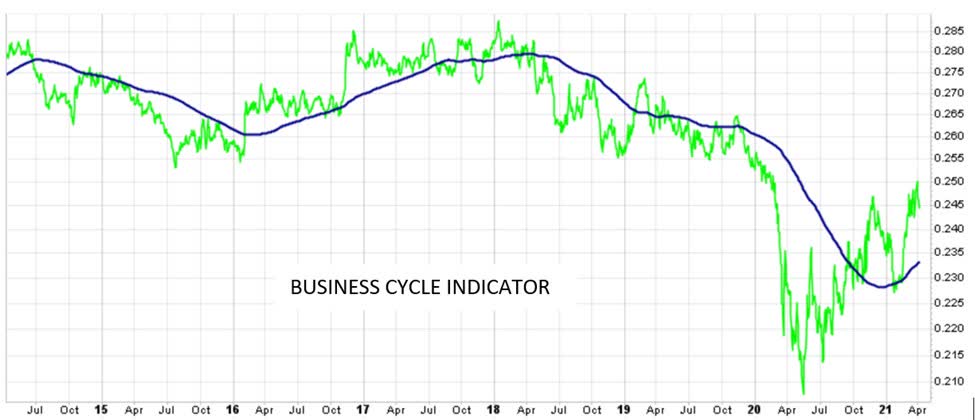
Source: StockCharts.com and The Peter Dag Portfolio Strategy and Management
Our real-time business cycle indicator reflects the changing trend of the business cycle as also shown by the growth in manufacturing employment. It bottomed in 2016, peaked in 2018, and bottomed in 2020. This indicator is updated in each issue of The Peter Dag Portfolio Strategy and Management on www.peterdag.com.
The new cycle, as discussed in early February, had a major impact on which market sectors were going to lead the market higher. As of this writing, the business cycle remains on an upswing. It implies business is still focused on replenishing inventories and catching up with demand.
(Click on image to enlarge)
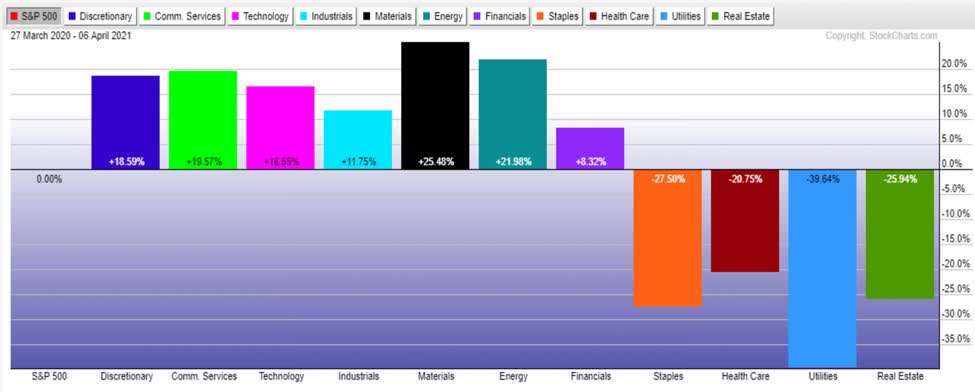
Source: StockCharts.com and The Peter Dag Portfolio Strategy and Management
The above chart shows the performance of the 11 sectors of the S&P 500 compared to the performance of the S&P 500 from March 27, 2020, to April 6, 2021. The numbers on the chart show the outperformance or underperformance compared to the S&P 500.
The sectors outperforming the S&P 500, not surprisingly, are still those most sensitive to the growth of the business cycle. Since March 2020, from left to right, the strong sectors have been discretionary, communication services, technology, industrials, materials, energy, and financials.
The sectors underperforming the S&P 500 have been staples, health care, utilities, real estate, and bonds (not shown on the chart).
The action of these sectors during the upswing of the business cycle is quite typical. Of course, when the business cycle declines because of the weakening economy, the performance of the two groups of sectors will be inverted.
During the downswing of the business cycle, the cyclical sectors will underperform the S&P 500 and the defensive sectors will outperform the S&P 500.
As of this writing, the action of the market is consistent with an improving business cycle in full accord with the message provided by the trend of the average workweek, manufacturing employment, and the business cycle indicator.
One more note. Momentum investing works because the price outperformance of these sectors is in synchronism with the phase of the business cycle – on the upside and downside. A typical upswing of the business cycle is about 2-3 years, and the downswing lasts about 1-2 years.
Key Takeaways
Price momentum works because it is dominated by the momentum of the business cycle in the upswing and downswing phases.
The sectors outperforming the S&P 500 since March 2020 are still those that in the past cycles have outperformed the market in periods of rising business cycle trends.
These sectors are likely to continue to outperform the market as long as the business cycle indicator keeps rising.
Disclosure: I am/we are long SPY, TLT. I wrote this article myself, and it expresses my own opinions. I am not receiving compensation for it. I have no business relationship with any ...
more

