
FHFA House Price Index: House Prices Up 0.3% In October
The Federal Housing Finance Agency (FHFA) has released its U.S. House Price Index (HPI) for October. Here is the opening of the report:
Washington, D.C. – U.S. house prices rose in October, up 0.3 percent from the previous month, according to the Federal Housing Finance Agency (FHFA) seasonally adjusted monthly House Price Index (HPI). The previously reported 0.2 percent increase in September remained unchanged.
The FHFA monthly HPI is calculated using home sales price information from mortgages sold to, or guaranteed by, Fannie Mae and Freddie Mac. From October 2017 to October 2018, house prices were up 5.7 percent. [Read more]
The chart below illustrates the monthly HPI series, which is not adjusted for inflation, along with a real (inflation-adjusted) series using the Consumer Price Index: All Items Less Shelter.
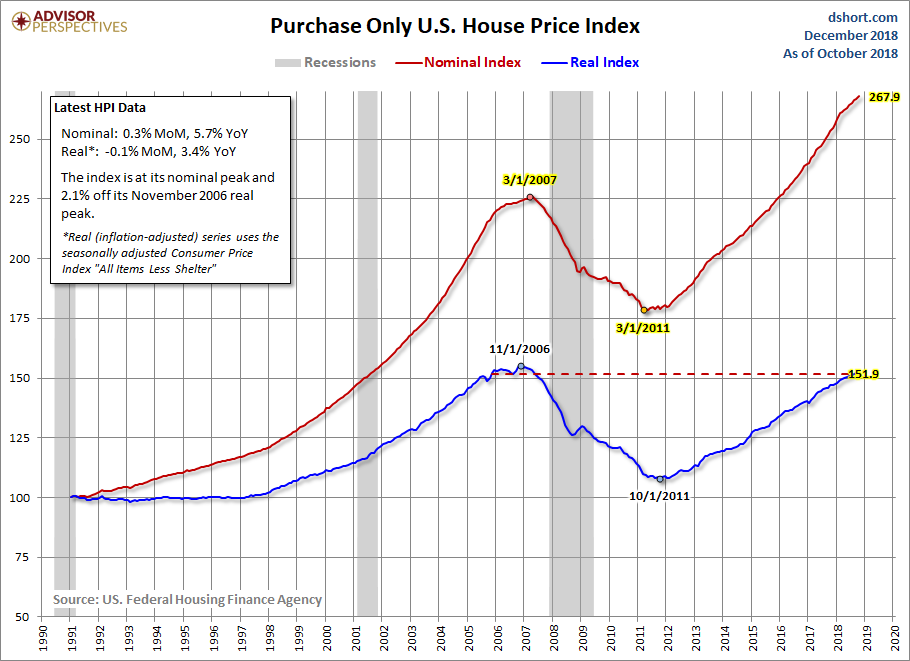
In the chart above we see that the nominal HPI index has exceeded its pre-recession peak of what's generally regarded to have been a housing bubble. Adjusted for inflation, the index remains off its historic high but is nearing its record of 155.2.
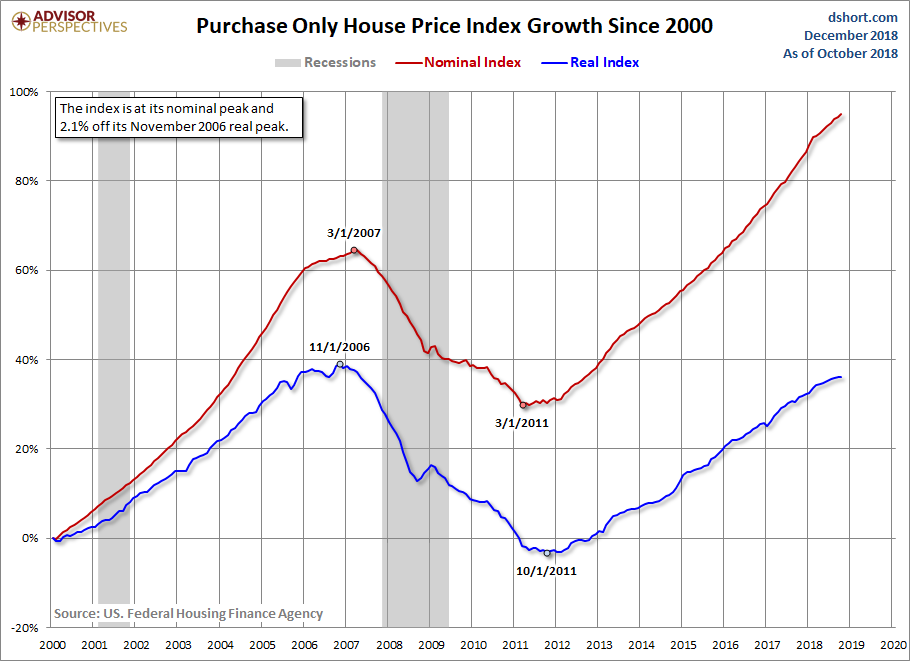
The next chart shows the growth of the nominal and real index since the turn of the century.
For an interesting comparison, let's overlay the HPI and the most closely matching subcomponent of the Consumer Price Index, Owners' Equivalent Rent of Residences (OER). Note: For an explanation of OER, see this PDF commentary from the Bureau of Labor Statistics.
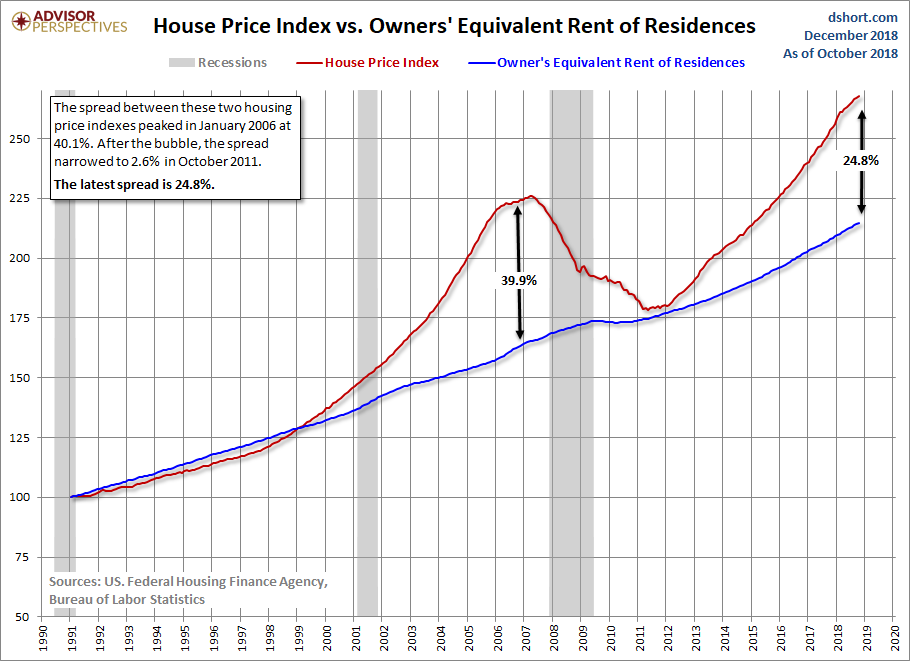
HPI and OER moved in close parallel from the 1991 inception date of the former until early 1999, when the two parted company and HPI began accelerating into the housing bubble. HPI then fell 20.7% over the next 48 months to its March 2007 trough. Confirmation of the "bubble" designation for house prices is the 40.1% spread between HPI and OER in January 2006.
Is another housing bubble forming? The current spread is 24.8%.
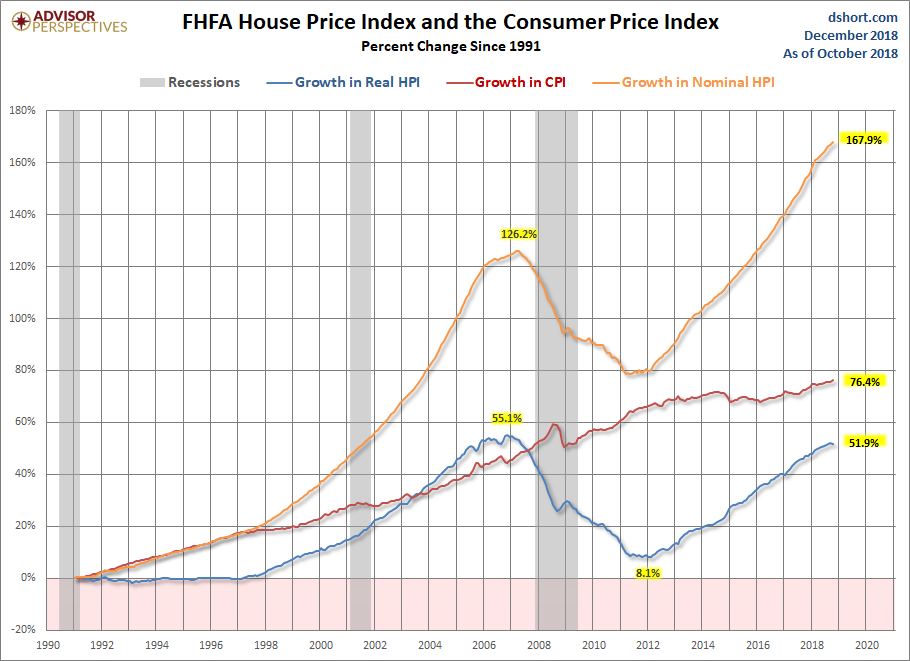
Here we compare the Consumer Price Index for All Urban Consumers to both the Nominal and Real House Price Index, which is a similar comparison to what we do in our Case-Shiller update. Nominal HPI growth has clearly taken off since 2012. However, when adjusted for inflation, the House Price Index has not seen as dramatic an increase since the late 1990s.


Housing is pretty ridiculously priced as is to be expected after the spate of absurdly low interest rates. I would still not encourage people to buy even though interest rates have risen. If anything, it increases the risk that a downturn will occur sooner rather than later. The big issue is are rents also overvalued. Most likely they are also, putting a big be careful sign on real estate ETFs which keep saying everything is great even as their prices decline. The simple fact that groups are trying to buy out houses to rent them in mass is a sign this cycle has gone too far.