
Fed Meeting, Nonfarm Payrolls, Tech Earnings Highlight Critical Week For S&P 500
The previous trading week commenced with a degree of frenzied selling pressure on Tuesday and within the context of slowing global growth and geopolitical uncertainty. Highlighting fears of a slowing global economy was the IMF downgrading its global growth outlook. With a failed Brexit vote and a U.S. government shutdown inside its 4th week, investors took shelter in bonds and gold, but that changed very quickly as liquidity remained supportive to equity markets.
Revisiting QE & Liquidity
As I mentioned in the past, central banks remain accommodative and the money supply into the global markets is adding liquidity to the financial system. This produces a risk-on environment, assuming all things equal that include the global economy. We witnessed examples of accommodative policy and activity centered on liquidity and increasing the money supply virtually all week from the People’s Bank of China (PBOC).
Based on the Tuesday selloff, it seemed as though the rally since January 2, 2019 was in jeopardy. That retracement, however, quickly turned higher the very next day and with the direct injection of liquidity from the PBOC.
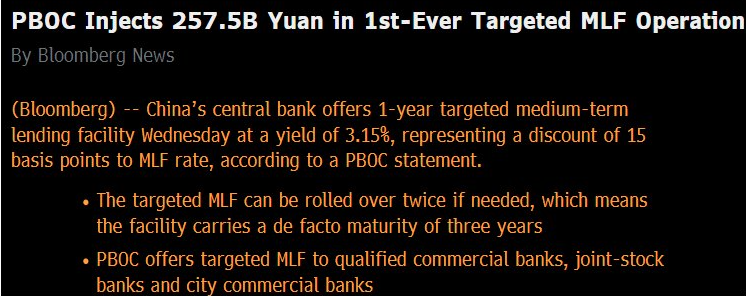
After this PBOC action, markets rebounded the very next day and the S&P 500 also rallied through Thursday. And what happened Thursday overnight? You guessed it, yet another round of easing and liquidity from the PBOC. Just like QE in the U.S., where financial system liquidity was boosted by the Fed injecting reserves into banks in exchange for sales of Treasurys and MBS, the PBOC announced that it will allow China's primary dealers to swap their holdings of perpetual bonds for central bank bills, and directly use those bonds as collateral to access certain PBOC liquidity operations.
Rabobank's Michael Every writes "Chinese banks, desperate for cash to keep the Ponzi scheme afloat, can issue perpetuals that nobody in their right mind would want to hold; and the PBOC will swap them for its bills." If you think what China is doing is normal, it isn’t, but neither was the U.S. TARP program and it’s QE program, which lasted for nearly 8 years. What we’re trying to suggest with this comparison is that something or many things are very, very wrong with the Chinese economy. Regardless of what we may think about the PBOC’s policies and activities, the markets like increased liquidity and money supply. The chart below identifies how much the global money supply has increased since it bottomed in November 2018.
When we combine the extreme PBOC policy stance with that of the Federal Open Market Committee (FOMC) here in the United States, we can better understand the newfound appetite for risky assets. The FOMC/Fed has quickly changed its more hawkish stance on monetary policy, which found the central bank raising rates 4 times in 2018, to that which is more accommodative and believed to halt rate hikes until its forecast for the economy improves alongside an increase in inflation.
With the latest round of liquidity injections from the PBOC and the European Central Bank concluding its meeting that also indicates rate hikes are unlikely until at least the summer of 2019, the FOMC will hold its 2-day meeting this coming week. Officials are expected to keep interest rates unchanged, but investors see scope for the Fed’s statement to tilt dovish, or for Powell to signal as much in his comments, a shift that could help drive yields lower. Also in focus, any hint that the central bank is closer to ending its balance-sheet runoff, which, combined with the deal to reopen the government, could bolster risk sentiment in favor of equities.
Probably the most important and still debated FOMC activity centers on the Fed’s balance sheet. Will, they or won’t they continue to unwind/sell the assets they hold on the balance sheet, nearly $4trn in Treasurys? Many economists and analysts have likened the balance sheet unwinding activities to that of raising rates and tightening fiscal monetary conditions. The Fed generally schedules these asset sales on the 15th, 20th and 25th of every month.
According to the Wall Street Journal, this very subject has also been front of mind with Fed officials and possibly will bring about the end of quantitative tightening.
Federal Reserve officials are close to deciding they will maintain a larger portfolio of Treasury securities than they’d expected when they began shrinking those holdings two years ago, putting an end to the central bank’s portfolio wind-down closer into sight.
Officials are still resolving details of their strategy and how to communicate it to the public, according to their recent public comments and interviews.
Fed officials led markets to expect the process would take several years to play out. When the runoff began in October 2017, various officials estimated the portfolio—then around $4.5 trillion—could shrink to anywhere between $1.5 trillion and $3 trillion. New York Fed President John Williams said in April 2017, when he was the San Francisco Fed’s president, that runoff could last five years.
“In about three or four years, we’ll be down to a new normal,” said Fed Chairman Jerome Powell at his Senate confirmation hearing in Nov. 2017."
Between all the newly introduced central bank liquidity and dovish language coming out of the ECB and FOMC, global equity markets have risen sharply in January 2019. Liquidity and dovish central banks are the “mother’s milk” of equity markets so to speak. But could they be getting ahead of themselves and mispricing risk? That’s a key question given the backdrop or reasoning as to why central banks are pumping liquidity into the system or reversing course on monetary policy and activities.
Market Volatility/VIX
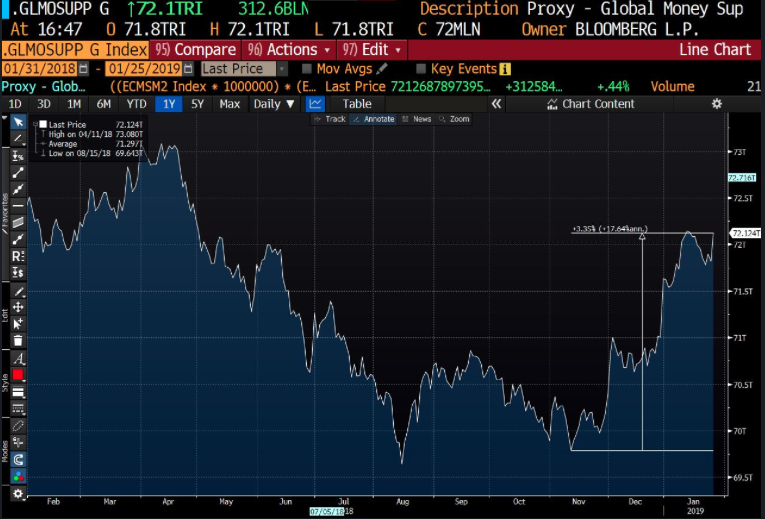
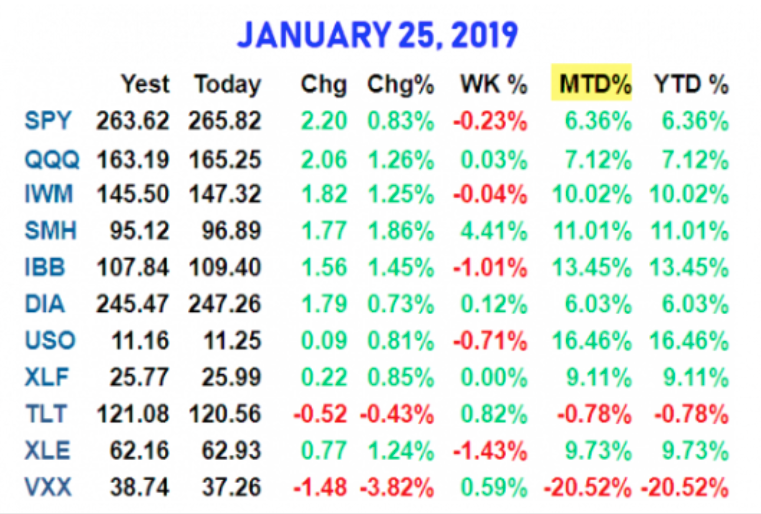
Even with the S&P 500 losing 5 points for the week, the VIX finished down 2.13% on the week at 17.42. This is a slight example of the difference between general market/investing activity and hedging activity for the week that was. But given the week ahead, what might be in store for the VIX and/or market volatility begs to be discussed. The chart below outlines the typical S&P 500 to VIX inverse relationship (SPX top chart, VIX bottom chart).
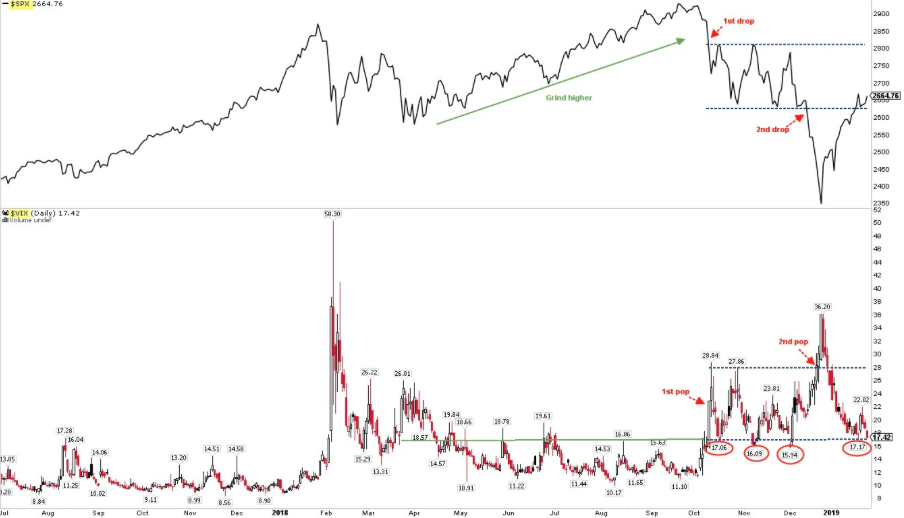
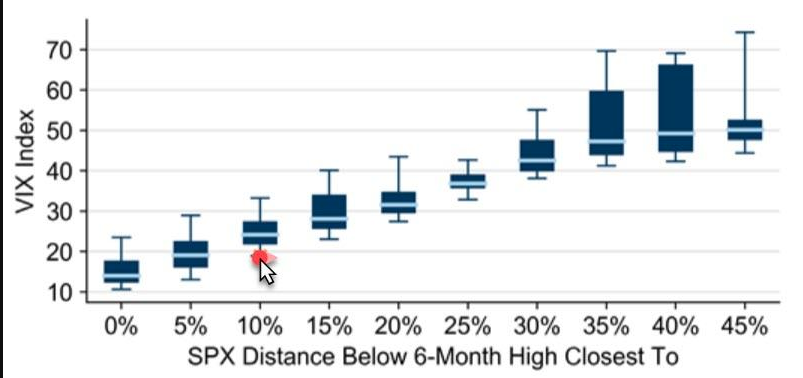
As the market has rebounded in January 2019, the VIX has plunged. Maybe it has retrenched more than it should have given that the S&P 500 is still some 10% below it’s all-time high level? It’s a question worth asking given the context of what is a technical bear market that is now in the corrective period and finds the S&P 500 at resistance levels. According to Goldman Sachs, distribution of VIX levels based on how far below its 6-month high the S&P 500 is (since 1993; box plot shows 5/25/50/75/95th percentiles) suggests the VIX is mispricing risk and lower than it should otherwise be given the parameters offered in the chart below.
Having said all of that about the potential for VIX options being cheap or mis-priced, one always plays with fire if choosing to outright, go long volatility. As a hedge, it might prove prudent and even an asset management discipline that many institutional traders utilize, but as a trading strategy it remains littered with risk and often with capital losses.
Another way of rationalizing the VIX and market volatility is by understanding regime change. Market volatility undergoes eternally shifting regime changes. Finom Group believes that 2018 was the commencing of such a volatility regime change from unusually low volatility/VIX to more normalizing volatility or elevating volatility. Depending on the market drivers, we’ll have to await further confirmation of the continuation of this volatility regime shift higher in 2019. Central bank policies and activities play a critical role when it comes to the level of volatility in the market, as they can either breed or drain confidence for risk/equities in the marketplace. Unfortunately, as we have commenced a volatility regime shift in 2018, central banks are now commencing either a reversal of monetary policy and/or injecting liquidity into markets in 2019, which muddies the forecast for all variables in the market.
One thing to keep in mind for the coming week is the maturity of Barclay’s VXX ETF. On Tuesday, the VXX exchange-traded note (ETN) will reach its final valuation date, at which point the note will cease to trade and holders of it will receive a cash payment representing the note's NAV. To date, only the minority of the VXX's AUM has rolled to competing products (the largest products with nearly identical economics are the VXXB and VIXY). Given that there is still significant AUM to unwind and if a substantial amount of VXX shares do not switch to comparable products, the note's issuer could have a large amount of VIX futures to sell at Tuesday's close, putting pressure on the February and March VIX futures.
S&P 500 Review & Outlook
The weekly expected move for the S&P 500 last week was $41 and given the total move of the week, the S&P 500 finished within the expected move. For the coming week, the expected move jumps a bit to $47/points. With the VIX sitting at the bottom of its 4-month range from which every big sell-off in SPX has started since October, it remains to be seen if that trend is broken or not. SPX is holding on to the bottom of its trading range from October to early December. A drop in VIX under 16 probably corresponds with SPX grinding its way back to the top of this range, near the 2,800 area. I am of the opinion the market desires at least to achieve 2,700, but it is highly depend on what “shakes out” in the fundamentals this week. Now let’s take a look at jus the S&P 500.
The S&P 500 has gained 13% since the low while the Nasdaq is up 16 percent. That’s a substantial move in just 4 weeks. According to LPL Financial’s Ryan Detrick, this is the market's best January in at least 30 years (table from alphatrends.net).
The January S&P 500 rally has brought it back above the area where it failed in mid-December, initiating a 10% drop over 7 days (green shading). This is also where SPX bounced higher in February, April, May, October, and November. The S&P 500 also closed above its 50-dma (the blue MA) the past 5 days in a row. This had been the top of its range since the September high (green arrows). What we believe is that the S&P 500 is indicating signs of strength.

The persistence of strength in SPX is seen in the top panel (above). The rallies in October and November died as soon as momentum became overbought (blue arrows). In comparison, this time SPX has been able to move through resistance.
In addition to the broader analysis of the S&P 500, we encourage investors and traders to review our most recent technical takeaways from the S&P 500 with Wayne Nelson in our weekend video review here.
There’s a great amount of positives we can take away from the January 2019 move higher and off the lows set in December. What I think most investors and traders desire mostly is to know whether or not we will pullback, retest or even make new lows near-term. Because history suggests we should at least pullback after a 13% move higher in the S&P 500 and the lows were set only 4 weeks ago, recency bias is prevalent and pervasive. With that said let’s look at history once again as it may lend itself to forecasting the next move for the S&P 500.
In the past 70 years, exceptionally strong breadth like we have seen since the Christmas low has never taken place within the context of a bear market. In fact, breadth momentum like this is often associated with the start of new bull markets. There have been 18 "breakaway breadth thrusts" since 1962 and only one was followed by a low retest (and it was a higher low). (Table from @twillo1).
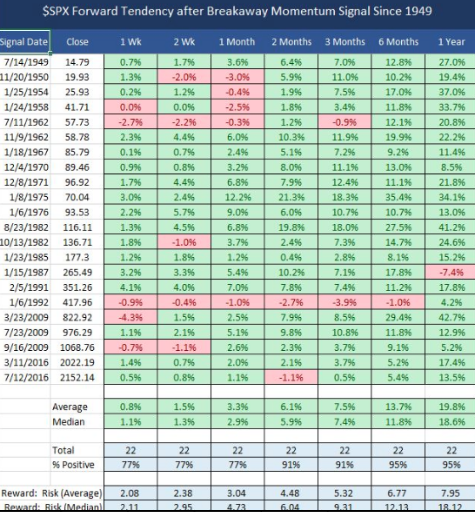
Since 1980, the large falls without a low retest were all followed by a breadth thrust; that includes both 1982 and 2009 as well as the second low in February 2016. In comparison, when SPX fell back to test its prior low, a breadth thrust was missing every time.
What’s being analyzed here is that breadth thrusts such as we saw 2 weeks ago generally occur when the fundamentals going forward don’t match the perceived market value at present OR, the market has priced in future fundamental performance. Now for one last historical reference point regarding the recent S&P 500 correction that persists until it reaches a new all-time high.
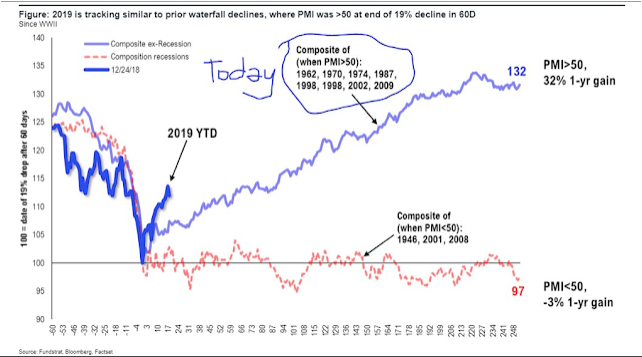
During the recent correction, the S&P 500 plunged about 20% in 60 days. This is rare, occurring only 10 times in the past 70 years. When this happened while the economy was non-recessionary, the S&P 500 continued to trend higher over the next year, gaining an average of 30% (blue line). When the plunge happened during a recessionary environment, the S&P 500 continued to fall (red line; from Tom Lee).
A 13% gain in just 21 days is extreme. Referring to the chart above, the average gain by 21 days is about half of what we have seen so far. So a period of consolidation and retrenchment in the weeks ahead would not be surprising, although it is not a certainty and dependent on the fundamentals and percieved central bank activity. Taking all that is outlined from the fundamentals and technical analysis, we are not of the opinion that the S&P 500 will retest (to the exact level) the December 2018 lows. This does not mean a pullback to some degree is unlikely.
Earnings, Sentiment & More
Before I get into the earnings and sentiment picture, we came into the trading week with the understanding that Q4 2018 earnings were important, but somewhat overshadowed by the macro and geopolitical outlook. From last week’s research report I offered the following:
“A great many variables will play a role in corporate earnings and revenues going forward. We denote these variables below:
- USD Index
- Global trade feud resolution
- Capital spending
- Housing sector trends
- Government Shutdown
- Consumer spending trends
- Fed remains dovish
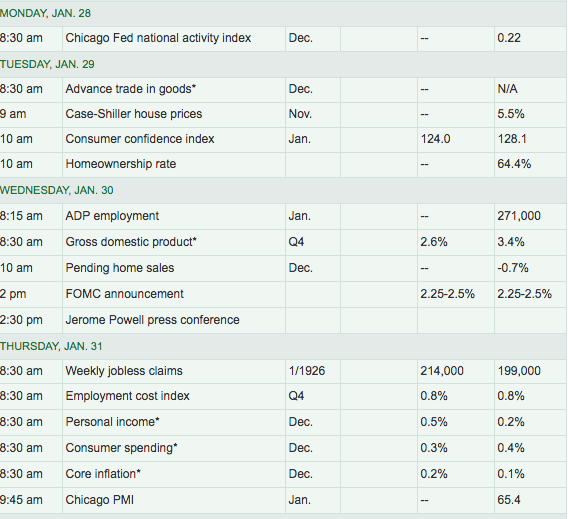
Fortunately, the government has reopened, but many issues remain up in the air and until we can assess the economic data in full. The table below represents the slew of economic data due out this week.
When we look at the earnings estimate scorecard to date for the Q4 2018 period, it is mildly improving according to FactSet data tracking. For Q4 2018 (with 22% of the companies in the S&P 500 reporting actual results for the quarter), 71% of S&P 500 companies have reported a positive EPS surprise and 59% have reported a positive revenue surprise.
Last week, the blended earnings growth rate of the companies that had reported was 10.7% for the period. Since then, the blended earnings growth rate for the S&P 500 has risen to 10.9 percent. If 10.9% is the actual growth rate for the quarter, it will mark the fifth straight quarter of double-digit earnings growth for the index.
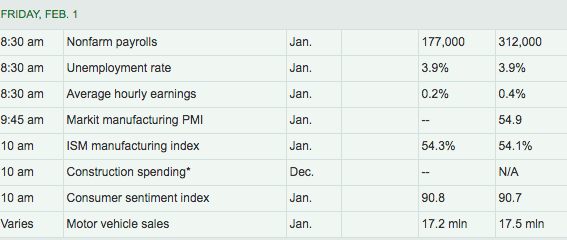
The actual blended (year-over-year) revenue growth rate of the companies that have reported for Q4 2018 is 6.1 percent. Again, this is higher than the estimate just a week ago from FactSet as shown in the table below
Now let’s look at what FactSet is forecasting for the next 4 quarters and FY19 earnings and revenues
Analysts expect low, single-digit earnings growth for the first three quarters of 2019.
- For Q1 2019, analysts are projecting earnings growth of 0.7% and revenue growth of 6.1%.
- For Q2 2019, analysts are projecting earnings growth of 2.4% and revenue growth of 5.3%.
- For Q3 2019, analysts are projecting earnings growth of 3.1% and revenue growth of 5.0%.
- For Q4 2019, analysts are projecting earnings growth of 11.1% and revenue growth of 6.2%.
- For CY 2019, analysts are projecting earnings growth of 6.3% and revenue growth of 5.2%.
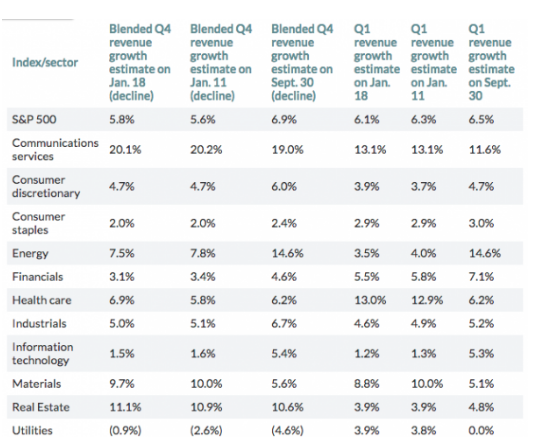
During the upcoming week, 126 S&P 500 companies (including 13 Dow 30 components) are scheduled to report results for the fourth quarter. Some key reports are indicated by date and time in the graphic below. Apple Inc. kicks off the tech component of the weekly earnings barrage after the closing bell on Tuesday.
With an understanding of FactSet’s estimates for earnings and revenues, we now deliver the same from Thomson Reuters, which are higher on average.
- Fourth-quarter earnings are expected to increase 14.3% from Q4 2017. Excluding the energy sector, the earnings growth estimate declines to 12.4%.
- Of the 112 companies in the S&P 500 that have reported earnings to date for Q4 2018, 72.3% have reported earnings above analyst expectations. This is above the long-term average of 64% and below the average over the past four quarters of 78%.
- Fourth-quarter revenue is expected to increase 5.6% from Q4 2017. Excluding the energy sector, the revenue growth estimate declines to 4.8%.
And finally, as it pertains to investor sentiment, bullish sentiment is still below historical average and probably mirrors the period of uncertainty that still remains with the market.
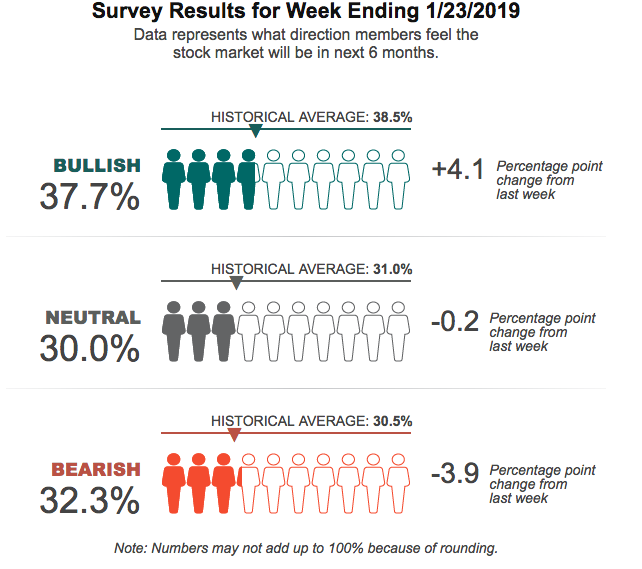
Pessimism among individual investors about the short-term direction of stock prices remains above average in the latest AAII Sentiment Survey. Optimism rebounded while neutral sentiment was slightly changed. Bullish sentiment, expectations that stock prices will rise over the next six months, rose 4.1 percentage points to 37.7 percent. Optimism is below its historical average of 38.5% for the 17th time in 20 weeks. Bearish sentiment, expectations that stock prices will fall over the next six months, declined by 3.9 percentage points to 32.3 percent. Pessimism is above its historical average of 30.5% for the 18th time in 20 weeks.


