
Fast Facts: Bad News For Housing--Two Straight Months Of Declining Sales
The NAR’s Pending Home Sales Index had its second straight year to year decline in November. This index represents contracts signed during the month. Most result in closed sales within 30 to 60 days. This is as close as we get to a real time barometer of actual housing market sales volume, although Redfin, an online real estate brokerage, reports a sample of the 19 big markets they represent a little earlier in the month. That measure also declined on an annual basis for two straight months. It may be time to start worrying that the pitiful housing “recovery” under way for two years has reached its limit.
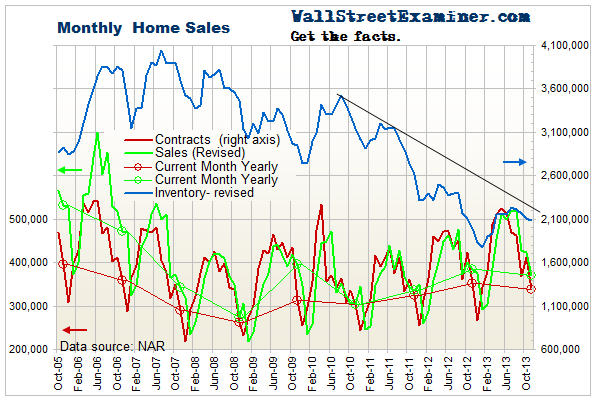
Monthly Home Sales – Click to enlarge
The seasonally adjusted headline number reported by the NAR, and dutifully regurgitated by the mainstream media, showed a rise of 0.2% month to month. That was weaker than the consensus expectation of economists of a 1% rise, but it does not capture the reality that the actual change from October was much worse than average. As is often the case, the seasonally finagled number failed to accurately reflect the reality.
November is always a weak month, but the 17.9% decline for the month was the worst November since November 2009, which was exacerbated by the expiration of an earlier Federal tax credit to home buyers which had stolen sales from the future. This November’s decline wasn’t quite as bad a drop as the 22% decline in November 2008 at the worst point in the housing crash, but it was worse than the 17.2% drop in November 2007, in the earlier months of the collapse.
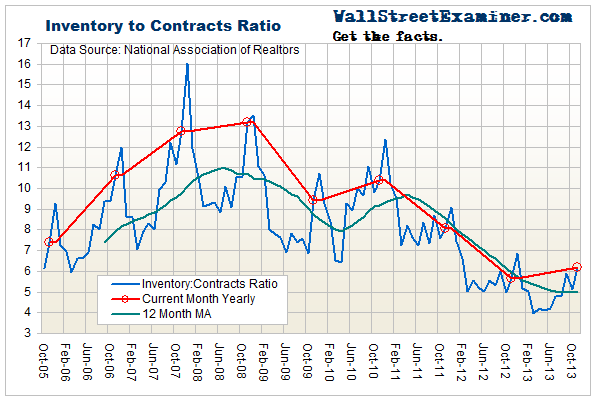
Home Inventory to Sales Ratio – Click to enlarge
Does this mean that recently bubbly house prices will come crashing down? Maybe. Inventories are not dropping like they usually do in the winter. Excluding 2010, which was skewed by the second home buyers’ tax credit, the inventory to sales ratio has turned up for the first time since 2008. It’s still at a historically low level, however. We may have to wait for the spring buying season to get a better idea of whether the trend of the supply demand balance has entered a sustained shift.
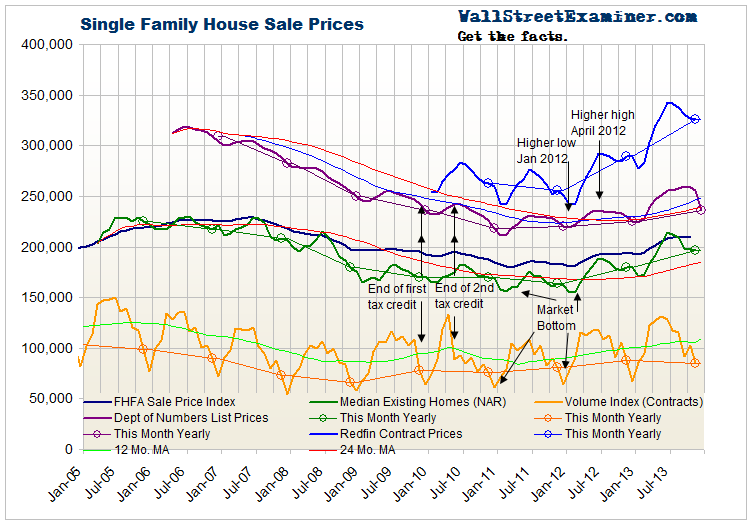
Housing Price Measures – Click to enlarge
Real time aggregated listing prices reported by Department of Numbers.com have accurately shown current price trends, subsequently confirmed by lagging sales data. Late December data shows a sharper than usual seasonal drop in asking prices nationally, but the overall uptrend is intact.
Get regular updates on the machinations of the Fed, Treasury, Primary Dealers and foreign central banks in the Fed Report in the Professional Edition, Money Liquidity, and Real Estate Package. ...
more

