
Falling New Home Prices, Mortgage Rates, Spark Housing Rebound
Fueled by falling new home prices and falling mortgage rates, the U.S. new home market is experiencing a rebound in its fortunes.
Starting with falling new home sale prices, preliminary and revised data reported by the U.S. Census Bureau for July 2019 shows that the average and median sale prices of new homes sold in the United States have continued a downward trend into mid-2019.
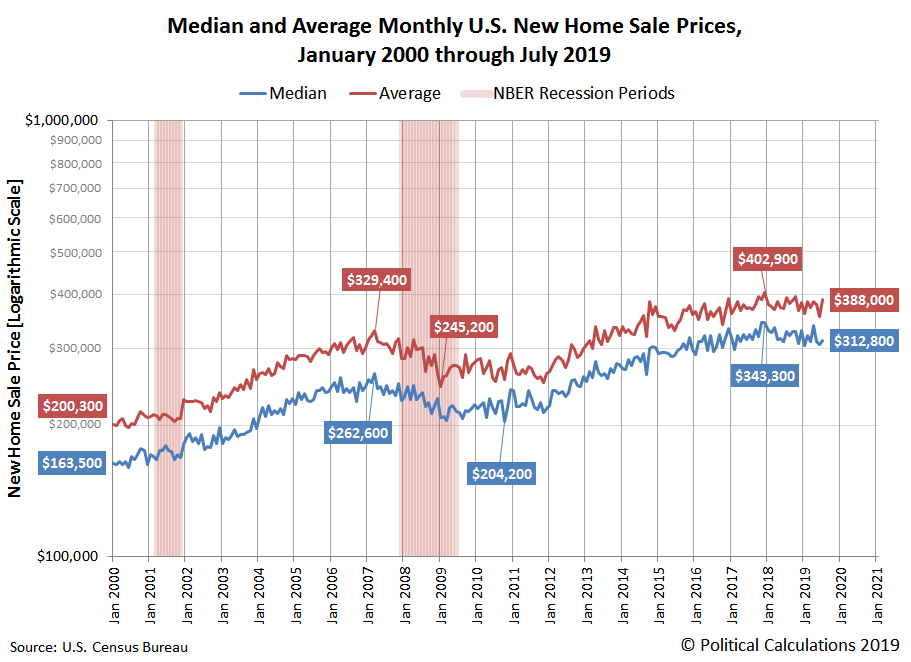
Focusing on median new home sale prices, the next chart presents the trailing twelve month average of these prices to smooth out month-to-month volatility in the data to identify trends since July 2012, which marked the beginning of a prolonged surge in median new home prices.

There have been three major trends during that time, each characterized by a relatively steady rate at which median new home sale prices rose, but with the rate of increase declining in each phase. The last upward trend saw prices escalate at an average rate of $930 per month from September 2015 to October 2018, after which the trend broke down and new home sale prices began falling instead. Had this last trend continued, we estimate that trailing year average of median new home sale prices of $318,483 shown in the chart above would be about $20,000 higher.
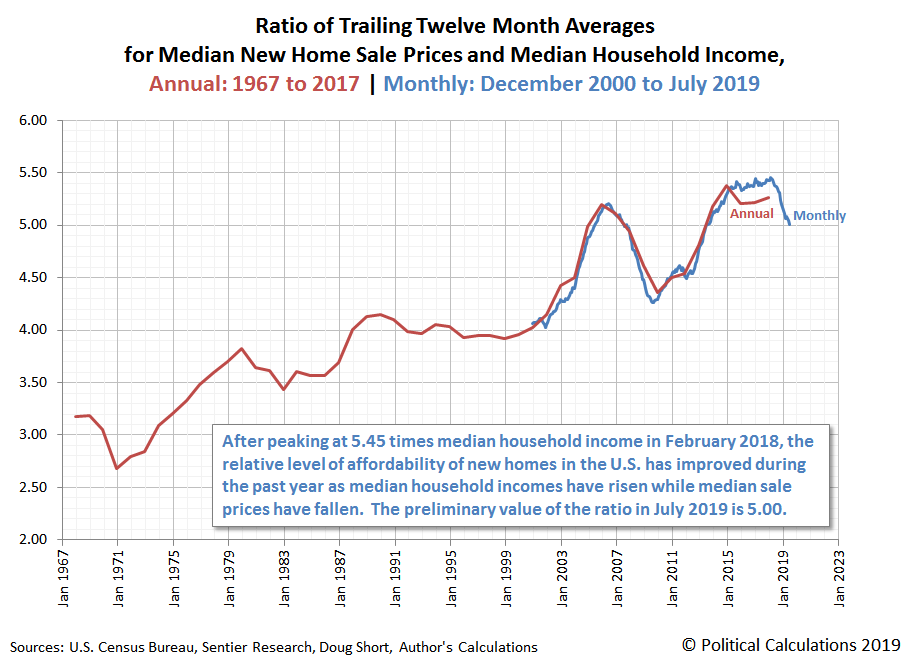
But that trend didn't continue, with median new home sale prices falling sharply as the median household income in the U.S. has risen, which has combined to make new homes in the U.S. the most relatively affordable they have been since August 2013. We can see that in the following chart showing the ratio of the trailing twelve-month averages of median new home sale prices and median household income, where the median new home in the U.S. has dropped to be five times the median household income.
But it's not just home prices that have been falling in the U.S. Mortgage rates have also been falling since they peaked at 4.87% in November 2018, where at 3.77% in July 2019, they are now more than a full percentage point lower than they were at that time. The following chart shows the evolution of 30-year conventional mortgage rates from July 2012 through July 2019:

The combination of falling prices and falling mortgage rates means that new homes have become considerably more affordable than they were at the end of 2018. New home buyers are responding to the stimulative effect of these changes, with the number of sales increasing dramatically in recent months. The following chart presents our estimate of the market capitalization of the new home market in the U.S., where we've multiplied the average sale price of new homes sold in the U.S. by the number of new homes sold.

In nominal terms, the preliminary estimate of the trailing year average market capitalization of new home sales in the U.S. is the highest it has been since March 2007. That there has been a sharp uptick in the U.S. new home market capitalization is confirmed by examining the trajectory of its year over year growth rate.

This latter chart also reveals that the U.S. new home industry's market cap was effectively shrinking between July 2018 and April 2019, which was becoming a drag on the U.S. economy. That situation has only recently reversed in the months since.
The question now becomes what will it take for that momentum to be sustained?
Disclaimer: Materials that are published by Political Calculations can provide visitors with free information and insights regarding the incentives created by the laws and policies described. ...
more

