
Expected Median S&P 500 Return In 2019
The most negative data points on the stock market and the US economy are Q4 earnings guidance and the ECRI leading index. Specifically, after the first 20 firms reported Q4 earnings 75% of them had their estimates lowered by an average of 6.63%. That’s the worst data The Earnings Scout has ever measured in 8 years of collecting data.
The ECRI leading index is down 6.5% year over year, which is the worst year over year decline in 363 weeks. The index increased 2.1 points in the first week of the year, but the tough comparison made growth fall in rate of change terms. The index’s growth rate peaked in January of last year. The index’s growth slowdown in 2018 eventually led to the correct forecast of the current slowdown.
The table below tests the weekly leading index’s accuracy.
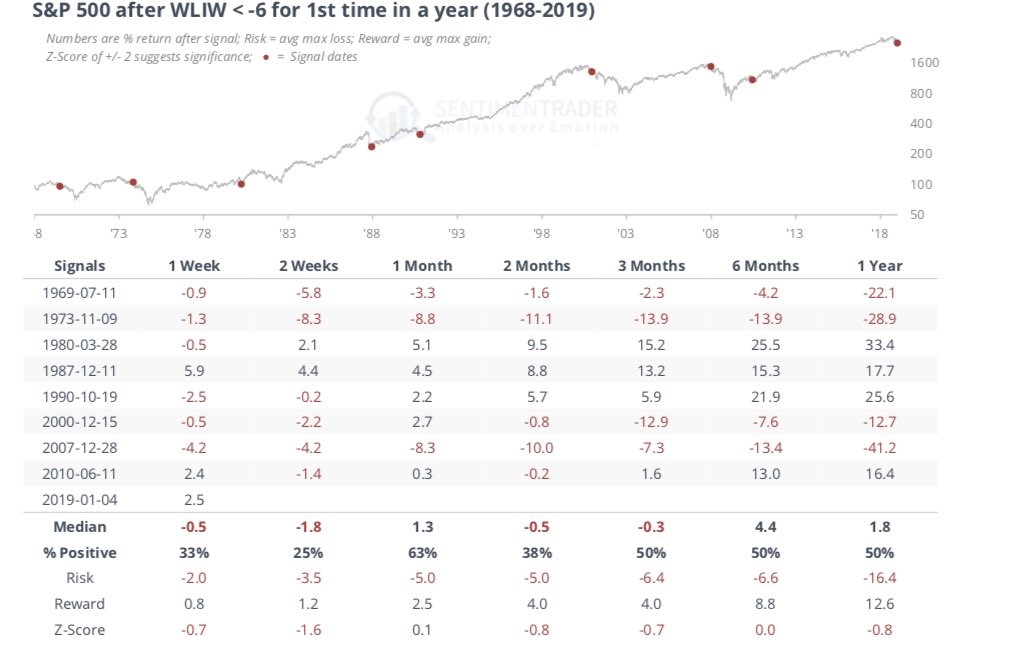
Source: Sentiment Trader
The red dots in the chart above signals when the index was down at least 6% year over year for the first time in 12 months. This signal is accurate, but the results vary based on the time period. It’s amazing that the median return after one year is only 1.8% with half of the instances positive and half of them negative. No indicator is going to have a perfect track record. Knowing there’s only a 50% chance stocks will increase in the next year is a huge advantage.
It’s interesting that in this current instance, stocks have bucked one of the most difficult tests as they increased 2.5% one week after the signal even though they had only increased 25% of the time leading up to this. The rally stemmed from stocks being oversold. You can really outperform the market if you use this as a tool rather than blindly following it with no concept of when stocks are overbought or oversold.
Very Small Move In Taxes
The tax Freedom Day represents theoretically how long Americans as a whole have to work in order to pay the nation’s tax burden. The deficit inclusive tax Freedom Day adds in the deficit which makes it later if there is a deficit and earlier if there is a surplus. Even though taxes were cut last year, the tax Freedom Day hasn’t moved much, and the deficit adjusted tax Freedom Day has moved even less as you can see from the chart below. The increase in spending increased the deficit.
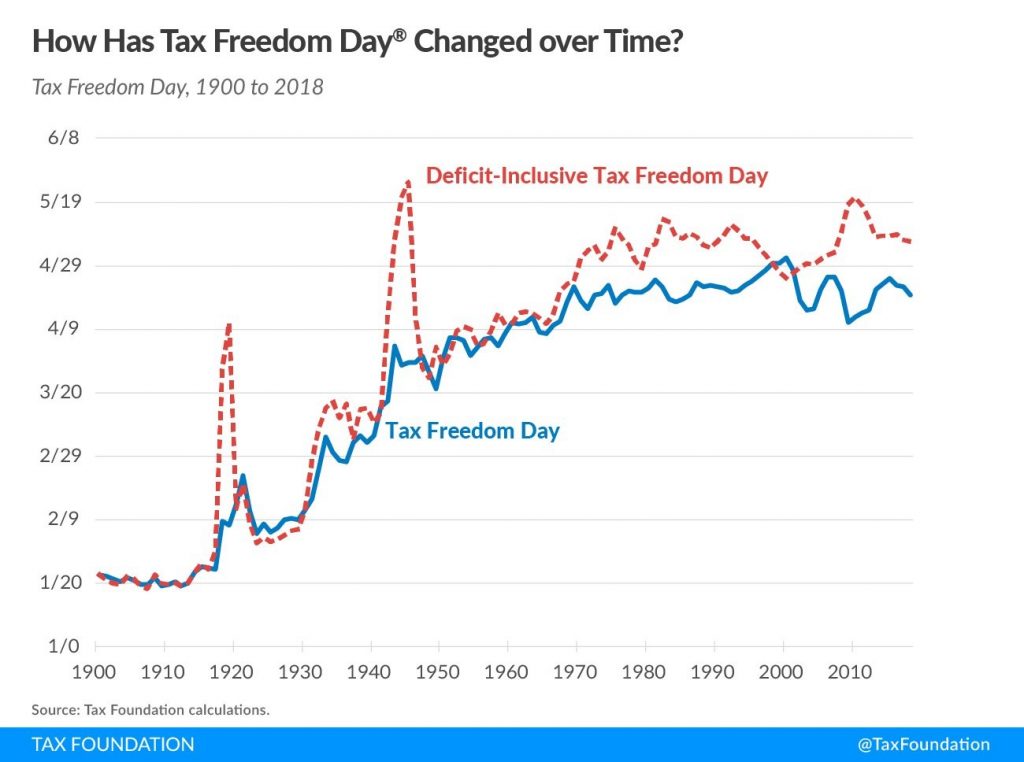
Source: Tax Foundation
Americans will pay $5.2 trillion in taxes in 2018 which is 30% of the national income. Taxes are more than what’s spent on food, clothing, and shelter combined. The most taxed state is New York and the least is Louisiana. This explains why NY ranks #1 in losing residents to other states. The supposed gigantic tax cut of 2018 only pushed the Tax Freedom Day 3 days earlier. It’s a far cry from where it was in the early 1900s when there wasn’t a huge entitlement state.
China Is Weakening Quickly
The Chinese economy is about to get a fiscal stimulus in 2019. It can’t come fast enough as the latest trade data shows the Chinese economy decelerated in December. Chinese exports were down 4.4% after rising 5.4% in the previous month. They were expected to rise 2%, so this was a huge miss. The miss was even worse for imports as they fell 7.6% in U.S. dollar terms after rising 3% in the previous month. They were expected to rise 4.5%.
The chart below shows the weakness in trade weighted imports from China’s top trading partners.
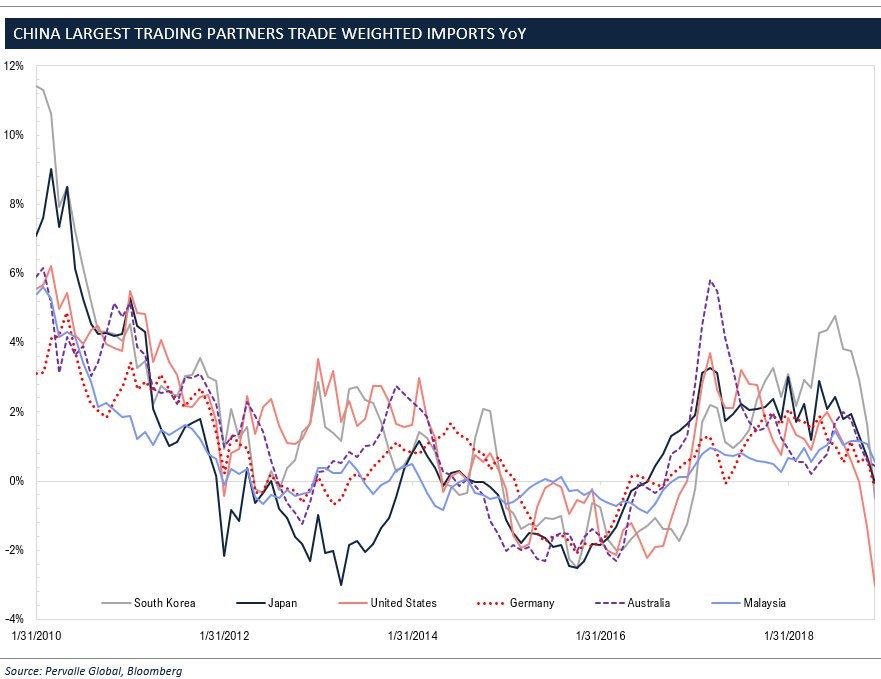
Source: Pervalle Global
According to this chart, US exporters into China are seeing the most weakness on a rate of change basis out of China’s top trading partners. However, this doesn’t show the weakness of Chinese based companies, which are being hurt substantially due to slowing economic growth. Chinese car sales are down over 4% in the past 3 months (on a 12 month rolling basis). This could be the weakest data in 4 decades.
It’s interesting that China’s surplus with America was up 17% in 2018 to $323.3 billion because Trump started the trade war partially because China has a big trade surplus with America. This was the highest surplus on record, going back to 2006. The increased deficit could imply that reaching a trade deal could be even more complicated. Exports to America were up 11.3% in 2018 and imports from America were only up 0.7%.
What Caused The Late-2018 Volatility?
We can never know for certain what caused the volatility in late 2018 and the rebound off the Christmas Eve bottom. However, it’s interesting to see what the Bank of America Merrill Lynch quant team has come up with.
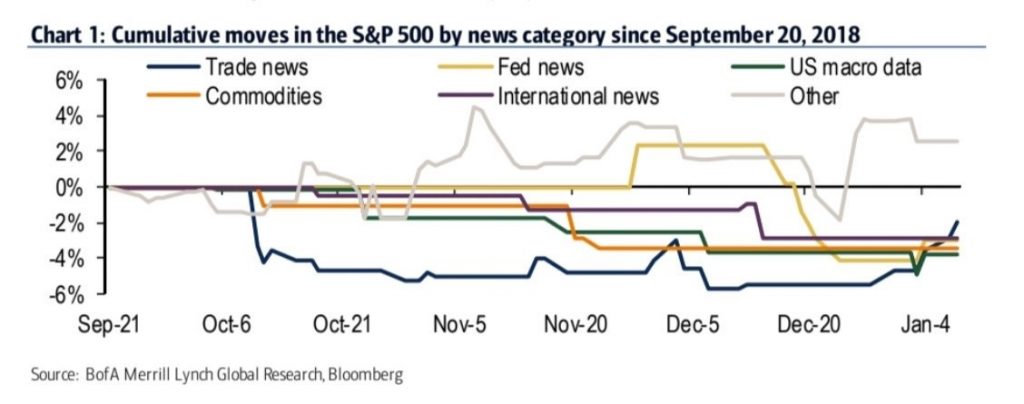
Source: Merrill Lynch
As you can see from the chart above, the trade news caused the volatility in early October. The commodities decline, specifically oil, caused the decline in late November. Macro data evenly affected declines throughout the rout. International news caused the decline in the middle of December, and the Fed caused the decline in late December after its meeting where it hiked rates and called for 2 hikes in 2019. The positive trade news is being referenced as a big reason for the January rally.
The trade war and the government shutdown are two instances where the American government is shooting itself in the foot. If it can avoid both by making a trade deal and re-opening the government, the US stock market could outperform Europe and China because of their sharp economic weakness relative to America’s more modest (currently) slowdown. The chart on the left shows stocks would have fallen less without the discouraging trade news.
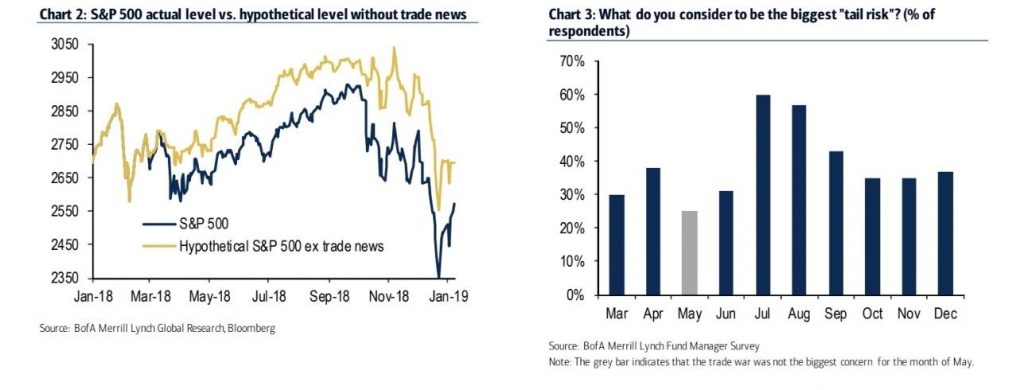
Source: Merrill Lynch
The chart on the right shows the trade war has been named the biggest tail risk every moth since March except in May. Whether these are primary reasons for the recent decline in asset prices or secondary, we will leave up to you to determine. In our view, at best these factors suggest secondary reasons with the primary reason for the decline in stocks being the slower economic growth in the US in rate of change terms.
Conclusion
The ECRI leading index and the latest analyst estimate changes after Q4 earnings reports are signaling bad news for stocks. The longer there is no trade deal and the government stays shut, this increases the probability of further significant slowing in US economic growth. Germany and Italy are headed for a recession. European industrial production fell 3.3%% year over year in November, which is its worst decline since December 2012. China’s latest trade data shows its economy is experiencing a significant slowdown.
Disclaimer: Please familiarize yourself with our full disclaimer here.


