
EURUSD Threatens Range Support As USD Bulls Re-Take Control
US DOLLAR BULLS PUSH BACK TO FINISH ERASING LAST WEEK’S LOSSES
Last week was a tale of two trends in the US Dollar, as the currency came into the week selling off, setting a fresh low on Thursday morning; at which point buyers came back to push prices above the 96-level on DXY. That strength has continued into this week’s open, and at this point, prices have already climbed above any levels traded at last week to create a fresh one-week-high. At this point, a bit of resistance has shown off of the previously-important 96.68 level, but given the momentum showing this morning, that may not hold for long.
US DOLLAR TWO-HOUR PRICE CHART
(Click on image to enlarge)
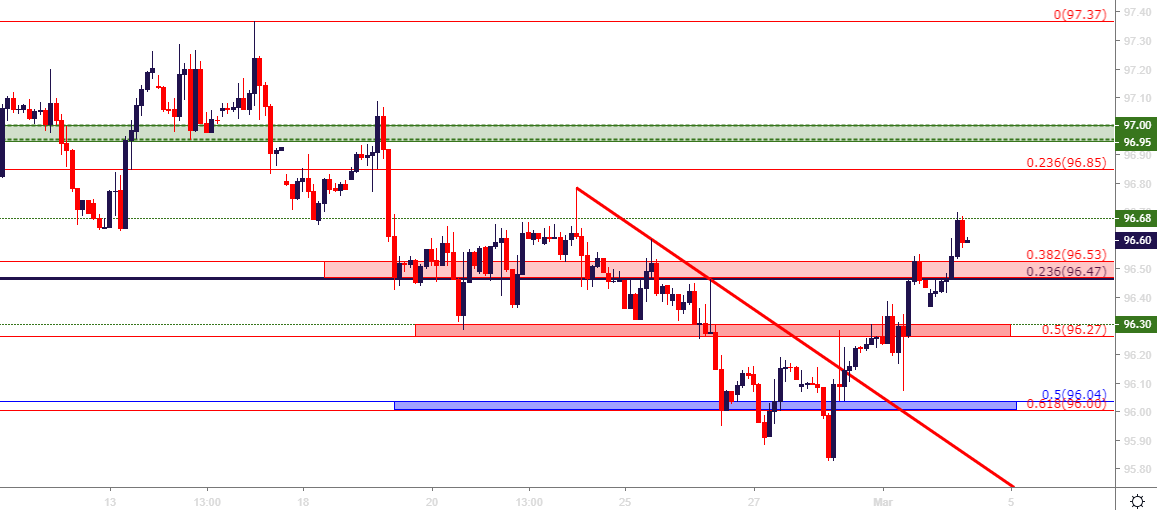
Chart prepared by James Stanley
A BUSY ECONOMIC CALENDAR AHEAD
This week is full of potential drivers, with both high-impact data and Central Bank rate announcements on the horizon. Tonight brings the RBA, Wednesday brings the Bank of Canada and Thursday the European Central Bank as rate policy takes center stage. On Friday, both US and Canadian jobs numbers are released at 8:30 AM ET and each of these will likely receive considerable focus in the latter portion of this week.
DAILYFX ECONOMIC CALENDAR – HIGH-IMPACT FOR THE WEEK OF MARCH 4, 2019 (ALL TIMES ET)
(Click on image to enlarge)
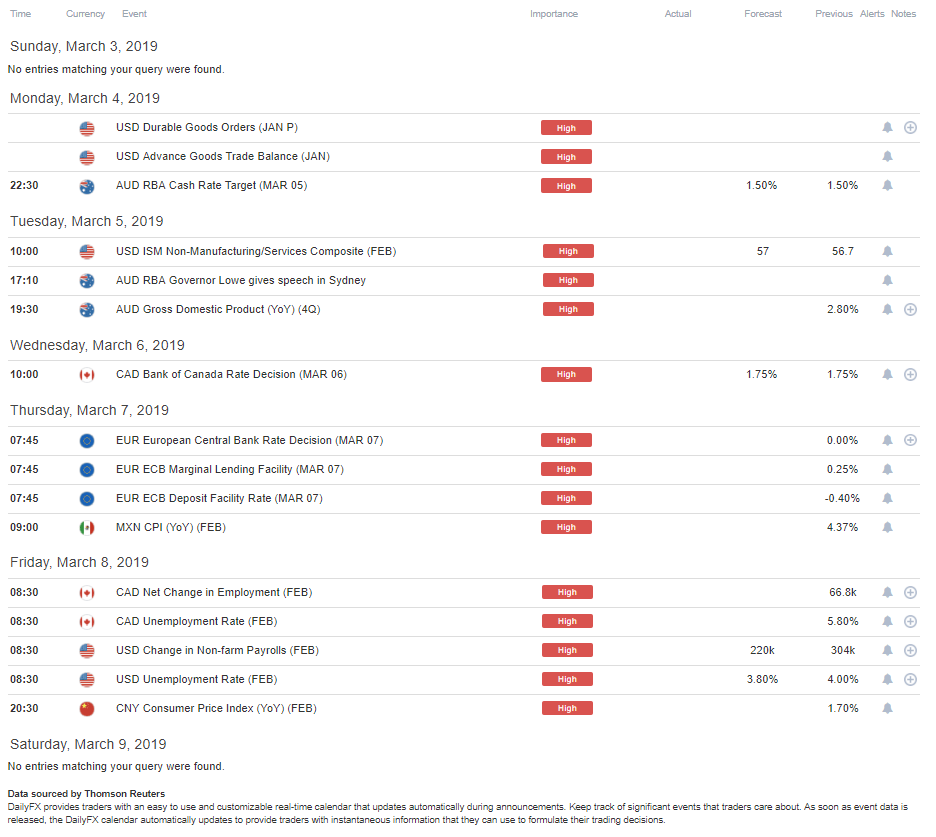
Chart prepared by James Stanley
EURUSD FALLS THROUGH FALLING WEDGE, MAKES RUN AT LONGER-TERM RANGE SUPPORT
The longer-term EURUSD range remains; but on a shorter-term basis, another formation had begun to build last week’s that’s filled-in, and that’s the rising wedge pattern that built in the middle of that longer-term setup. I had discussed this formation in Thursday’s webinar, and sellers have thus far posed a bearish breach through the bottom side of the formation. The longer-term support zone that runs from 1.1215-1.1300 is fast-nearing, and this carries with it the question of whether or not Euro bears will be able to make a deeper push within or, perhaps even below that area on the chart.
EURUSD FOUR-HOUR PRICE CHART
(Click on image to enlarge)
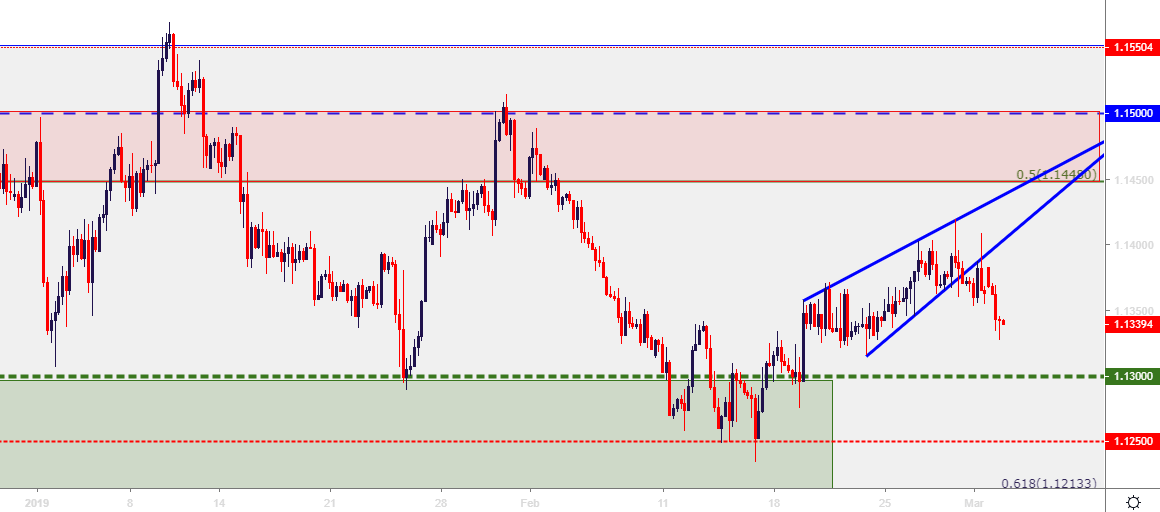
Chart prepared by James Stanley
GBPUSD BREAKOUT PULLS BACK TO FIBONACCI SUPPORT
The aggressive bullish rip in GBP has finally started to slow after a very respectable showing in the second half of February. As diminishing odds for No-Deal or Hard-Brexit options have gotten priced-out of the market, bulls have re-grabbed control of Sterling price action. As looked at last week, that move quickly got overbought and the re-appearance of USD-strength on Thursday and Friday helped to push prices back down to support.
Ahead of last week’s close, GBPUSD settled at support around the 1.3187 Fibonacci level that was looked at earlier in the day. After a bounce to open this week’s trade, sellers have made another push down to this Fibonacci level before seeing a similar response. On the below chart, this support area has been highlighted, but I’ve also added a bearish trend-line taken from last week’s swing-highs. This presents a descending triangle formation, which will often be approached in a bearish fashion; and this may be helpful for long-term GBPUSD bulls, as this may highlight the potential for a deeper check of support around the 1.3117 area on the chart.
GBPUSD TWO-HOUR PRICE CHART
(Click on image to enlarge)
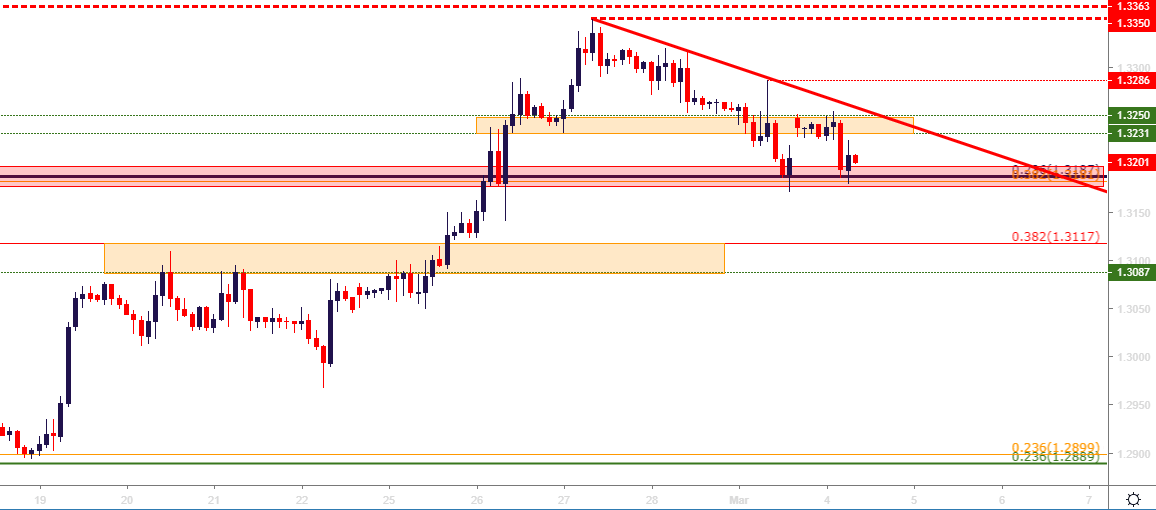
Chart prepared by James Stanley
USDJPY CHECKS 112.00 – CAN BULLS CONTINUE TO PUSH?
Last week saw two topside breakouts in USDJPY as Yen-weakness has become one of the more workable themes across the FX space. The first breakout didn’t take, but after pulling back to find support around prior swing-lows, buyers were able to push a successful breakout on the second attempt, taking place around Thursday/Friday as USD-strength came back into favor.
USDJPY is now nearing the 112.00 handle, and just beyond this level is an imposing area of support around the 112.34 Fibonacci level. This is the 76.4% retracement of the same major move that’s caught a series of support/resistance levels with this year’s price action; and that price of 112.34 offered multiple support inflections in Q4, just before USDJPY began to tank.
USDJPY DAILY PRICE CHART
(Click on image to enlarge)
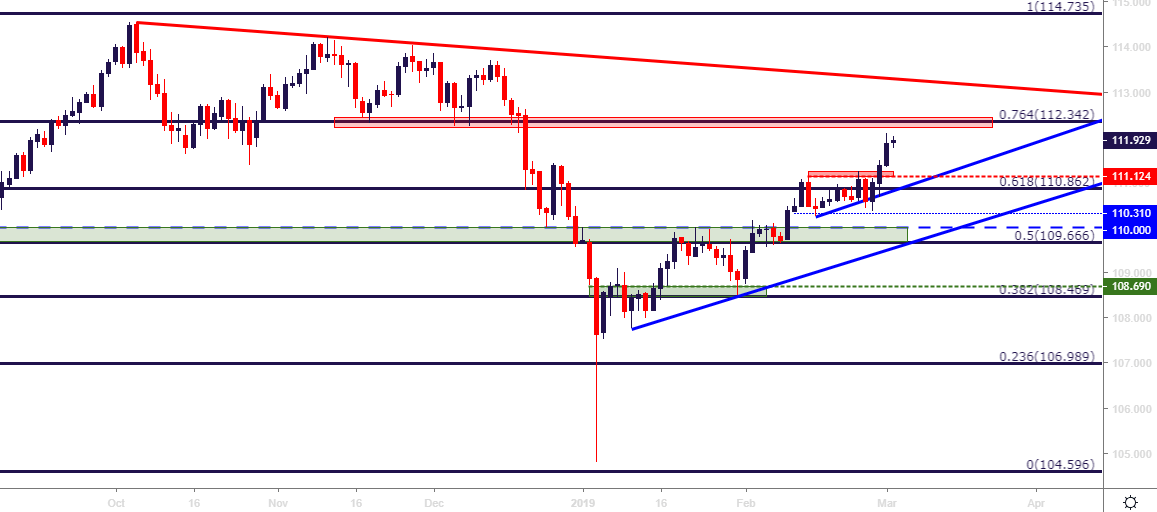
Chart prepared by James Stanley
USDCAD BULLS GET BUSY
I had looked at Oil on Friday, sharing that prices had just begun to test a key area of resistance. That resistance elicited an outsized reaction on Friday that Oil markets haven’t quite recovered from yet, but along the way went CAD weakness as the Canadian currency quickly fell along with Oil.
I had looked at bullish ideas in USDCAD in Thursday’s webinar, and after last week’s response, there may be the potential for continuation. USDCAD has just started to test the 1.3325 resistance level, and just above this area a series of Fibonacci levels that helped to mark the January swing-highs. If prices can stage a topside break through this zone that runs from 1.3361-1.3385, bullish longer-term strategies may soon become attractive again in USDCAD.
USDCAD FOUR-HOUR PRICE CHART
(Click on image to enlarge)
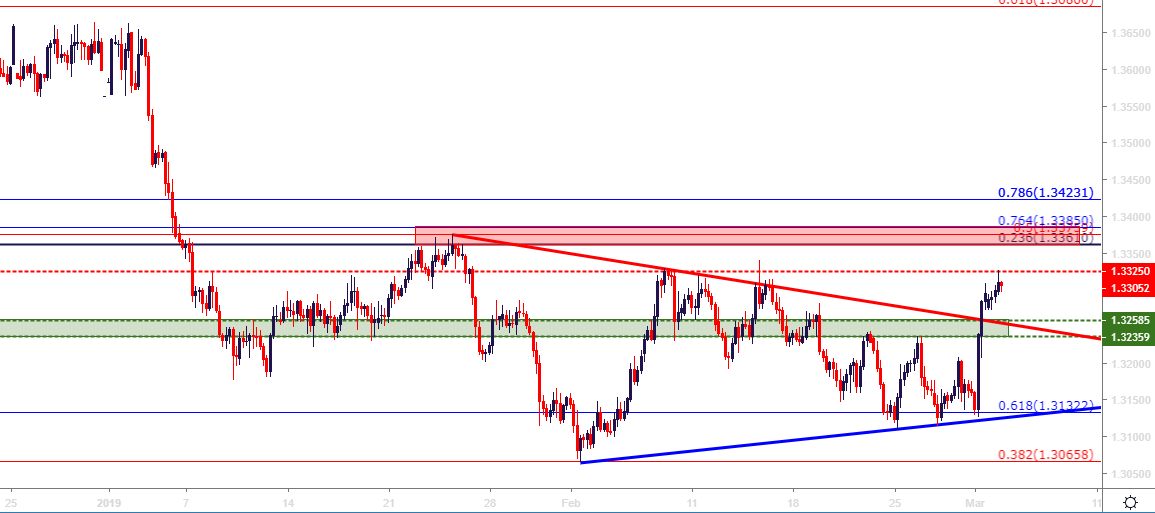
Chart prepared by James Stanley


