
EUR/USD Rate Outlook Hinges On 2021 ECB Forward Guidance
EUR/USD trades back above the 50-Day SMA (1.2081) as it extends the rebound from the monthly low (1.2054), and the pullback from the monthly high (1.2350) may turn out to be an exhaustion in the bullish price action rather than a change in trend like the behavior seen in September.
(Click on image to enlarge)
Looking ahead, the ECB may merely attempt to buy time on January 21 after expanding the pandemic emergency purchase program (PEPP) by EUR 500B at its last meeting for 2020, and it seems as though the central bank will rely on its current tools to support the Euro Area as the account of the December meeting emphasized that “the PEPP was seen as the cornerstone of the Governing Council’s monetary policy package.”
However, the ECB may continue to endorse a dovish forward guidance as Germany plans to extend the renewed COVID-19 restrictions until February 14, and it remains to be seen if the central bank will further utilize its non-standard tool in 2021 as President Christine Lagarde and Co. stand “ready to increase the envelope further if needed.”
In turn, the ECB’s first meeting for 2021 may do little to influence the near-term outlook for EUR/USD as the central bank appears to be on track to retain the current policy, and key market themes may continue to sway the exchange rate as the US Dollar still reflects an inverse relationship with investor confidence.
(Click on image to enlarge)
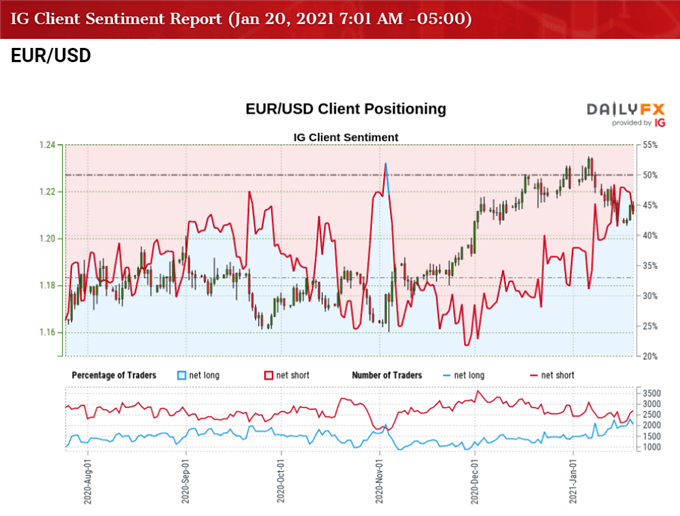
At the same time, the tilt in retail sentiment looks poised to persist as traders have been net-short EUR/USD since November, with the IG Client Sentiment report showing 44.25% of traders net-long the pair as the ratio of traders short to long stands at 1.26 to 1.
The number of traders net-long is 3.79% lower than yesterday and 8.93% higher from last week, while the number of traders net-short is 6.20% higher than yesterday and 0.92% lower from last week. The rise in net-long interest comes as EUR/USD carves a series of higher highs and lows from the monthly low (1.2054), while the decline in net-short position has helped to alleviate the crowding behavior as 45.12% of traders were net-long the pair during the previous week.
With that said, the correction from the January high (1.2350)may end up being an exhaustion in the bullish EUR/USD trend rather than a change in market behavior as it quickly climbs back above the 50-Day SMA (1.2081), but the exchange rate remains susceptible to a larger pullback as long as the Relative Strength Index (RSI) tracks the downward trend established in December.
EUR/USD RATE DAILY CHART
(Click on image to enlarge)
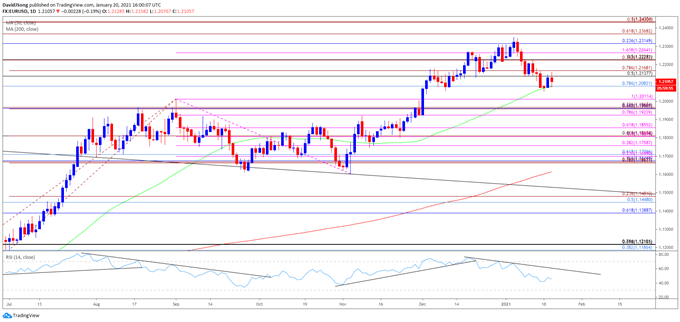
Source: Trading View
- Keep in mind, the EUR/USD correction from the September high (1.2011) proved to be an exhaustion in the bullish price action rather than a change in trend following the string of failed attempts to close below the 1.1600 (61.8% expansion) to 1.1640 (23.6% expansion) region, with the Relative Strength Index (RSI) highlighting a similar dynamic as it broke out of the downward trend carried over from the end of July to recover from its lowest readings since March.
- The break/close above the 1.1960 (38.2% retracement) to 1.1970 (23.6% expansion) region pushed EUR/USD to a fresh yearly highs throughout December, with the exchange rate taking out the 2020 high (1.2310) during the first week of January.
- However, EUR/USD has snapped the monthly opening range following the failed attempt to test the April 2018 high (1.2414), with the exchange rate susceptible to a larger pullback as long as the RSI tracks the downward trend established in December.
- Nevertheless, the dip below the 50-Day SMA (1.2081) appears to have been short-lived as EUR/USD carves a series of higher highs and lows from the monthly low (1.2054), but need a close above the Fibonacci overlap around 1.2140 (50% retracement) to 1.2370 (61.8% expansion) to bring the 1.2220 (38.2% expansion) to 1.2260 (161.8% expansion) region back on the radar.
- At the same time, failure to get back above the Fibonacci overlap around 1.2140 (50% retracement) to 1.2370 (61.8% expansion) may push EUR/USD back towards the 1.2080 (78.6% retracement) area, with the next region of interest coming in around 1.2010 (100% expansion).
Disclosure: See the full disclosure for DailyFX here.


