
EUR/USD Price Outlook: Support Grind At 1212 Ahead Of ECB, FOMC
EUR/USD IN FOCUS AHEAD OF FOMC, ECB – CAN THEY BREAK THE VOL SLUMP?
The next two weeks bring key rate decisions out of both the US and Europe; each of which are highly-expected to carry some form of dovish policy as discussed by our own Nick Cawley earlier today. The ECB meeting is set for next Thursday, and the FOMC rate decision is the Wednesday after. In the US, the Federal Reserve is expected to cut rates for the first time in over a decade to the tune of 25 basis points. There are even some expectations for up to 50 basis points of cuts at the July meeting, and markets are currently looking for a total of three 25 basis point cuts by the end of this year. In Europe, expectations are high for a 10 basis point cut as Mario Draghi hosts one of his final rate meetings at the bank with his term is set to conclude in November.
In EUR/USD, volatility remains rather low as prices continue to show an element of digestion that’s been around for a couple of months now. After starting a bearish trend in April of last year on the back of fears around the political scenario in Italy, EUR/USD built-in support above the 1.1100 handle in the month of May, presenting a number of bear traps as sellers dried up. Since then, prices have stuck to a series of higher-highs and higher-lows through the month of June and the first half of July.
On the below weekly chart of EUR/USD, the Average True Range indicator has been applied to illustrate this waning volatility as prices have continued to compress through 2019 trade.
EUR/USD WEEKLY PRICE CHART: ATR APPLIED, VOLATILITY COMPRESSION
(Click on image to enlarge)
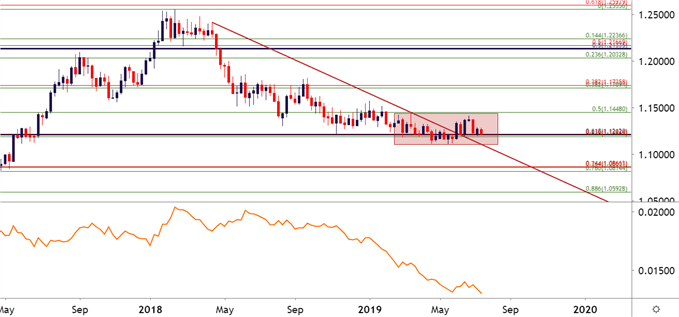
Chart prepared by James Stanley
EUR/USD HIGHER-HIGHS, LOWS SINCE BEAR TRAPS IN MAY
The sell-off in EUR/USD was already fairly extended coming into 2019. And this year has produced a dovish flip at the Fed after the bank’s four rate hikes last year. This has helped to bring some USD-weakness into the mix and when combined with the longer-term oversold nature of the Euro, this allowed for a short-squeeze scenario to come into play in the month of June.
Key for that theme form a technical basis was a range of support that’s had some element of pull on price action since coming back into play last November. This range runs from 1.1187-1.1212, with the former of those prices functioning as the 50% marker of the 2017-2018 up-trend; and the former price is the 61.8% retracement of the ‘lifetime move’ in the Euro. That 1.1212 level has come into play during many market themes since the Euro’s inception, and current price action is continuing to base support around this level.
EUR/USD DAILY PRICE CHART
(Click on image to enlarge)
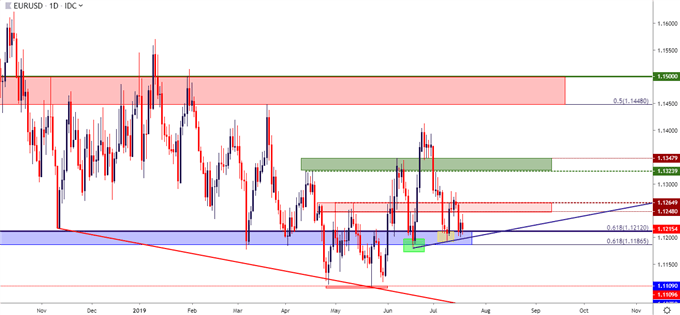
Chart prepared by James Stanley
EUR/USD STRATEGY
At this point, the door remains open for topside swing strategies. This could be driven by expectations for a continued short-squeeze in the pair, bearish strategies around the US Dollar, or a dovish stance out of the FOMC beyond the rate cut that’s well priced-in for later this month. Until that support zone ultimately gives way, traders are likely going to want to remain cautious around short-side stances in the pair with targets directed towards that 1.1000 big figure that hasn’t been traded at for more than two years.
EUR/USD TWO-HOUR PRICE CHART: A MONTH OF HIGHER LOWS AS KEY SUPPORT HOLDS SELLERS AT BAY
(Click on image to enlarge)
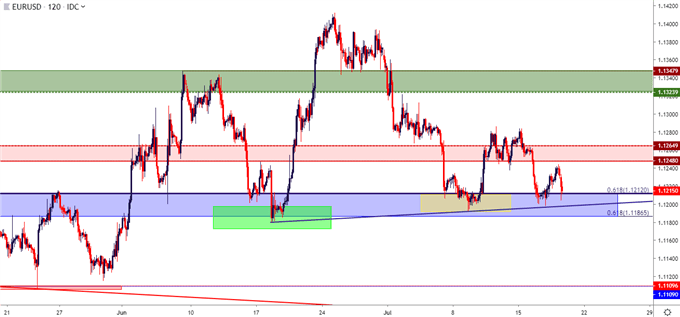
Chart prepared by James Stanley
EUR/USD BEARISH SCENARIOS
As mentioned above, given the adherence to support and the past month of higher-lows, EUR/USD bears will likely want to remain cautious until that longer-term zone of support gives way. But – given that we have an ECB meeting next week ahead of the FOMC, and that potential certainly exists, particularly if the bank talks up the prospect of even more QE.
For this approach, a break of the late-June swing-low around 1.1180 could open the door for bearish breakout strategies down to 1.1120. At that point, break-even stops could be investigated with deeper target potential down to 1.1135, 1.1076 and then the big figure at 1.1000.
EUR/USD DAILY PRICE CHART
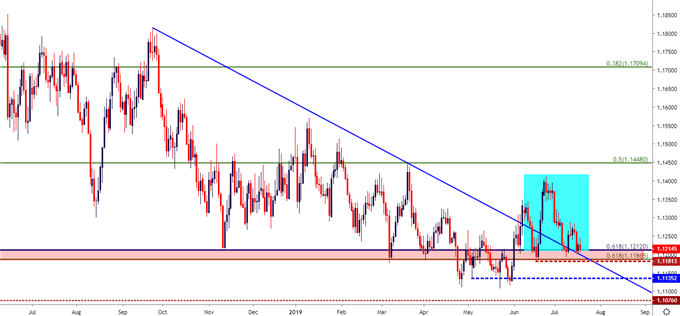
Chart prepared by James Stanley


