
EUR/USD Moves In For Another Test At 1.1300 As USD Re-Claims 97.00
EURO BACK ON OFFER AS ITALIAN BUDGET OPTIMISM DISSIPATES
A bit of optimism showed around the single currency yesterday as news began to spread that Italy was close to softening their deficit targets. This morning has seen that optimism turn towards confusion as a set of conflicting reports have indicated two totally different directions: One report earlier this morning indicated that Italy was set to cut its planned deficit target for next year and this helped to provide a temporary boost to Italian bonds. But, a little later, Italian bonds gave up gains after a report began to circulate citing Matteo Salvini that indicated Italy will not submit a revised budget to the EU.
For a bit of background: Last month saw the European Commission reject Italy’s budget as the country had planned for a 2019 budget deficit of 2.4%. The European Commission wanted to see this at no higher than 2%, driven out of worries from Italy’s already heavy debt-to-GDP ratio and the fear that a budget deficit greater than the country’s growth rate would amount to even more debt.
But the Italian government coalition was elected earlier this year on a platform of relaunching growth and development, which generally requires an initial investment of increased spending; and this put the recently-elected government at odds with the European Commission. In some ways, this was the same growth v/s austerity debate that’s played out around the Euro-Zone in a previous example around Greece. But, in other ways, this situation was far more threatening as this was coming from the third largest economy in the Euro-Zone that could bring large repercussions for future such instances.
As this theme has played out, it’s had a generalized Euro-negative effect, first showing in April and May of this year and then coming alive again in late-September as the budget clash neared. Over this period of time, EUR/USD has fallen from an April-high above 1.2400 down to fresh yearly lows just above 1.1200. Support has, thus far, held above a key Fibonacci level at 1.1212.
EUR/USD DAILY PRICE CHART: 2018 WAVES OF WEAKNESS IN THE EURO AS DRIVEN BY DYNAMICS AROUND ITALY
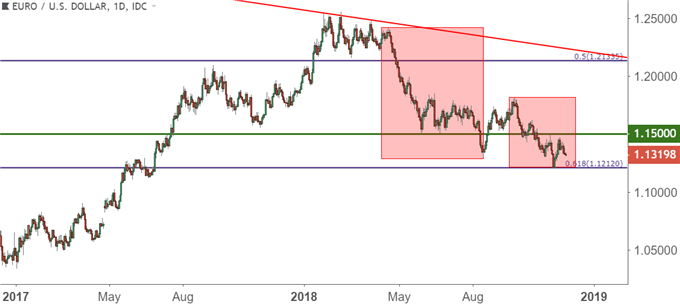
Chart prepared by James Stanley
Coming into this week, the Euro had caught a bid as reports were circulating that the Italian government may be open to cutting this 2019 budget deficit to 2.2%; or perhaps even as low as 2.0%. This helped to bring on a rally in Italian assets as well, and the yield spread between Italian and German bonds moved back below 3%.
But, up to this point, the Italian government has been unable to agree upon those decreased deficit targets, and Euro sellers have come back, perhaps partially assisted by commentary from ECB officials yesterday denoting slowing growth in the bloc. That, combined with this morning’s conflicting reports that continue to carry a general tone of negativity for the Euro, and have helped to push prices right back to the 1.1300 level. This is giving a fresh pattern of lower-lows and lower-highs on short-term charts, with current support showing just above that psychological level. This can keep the door open for short-side approaches with prices staying below 1.1400, and the door may soon be re-opening for short-side breakouts with targets set for a re-test of the yearly low.
EUR/USD HOURLY PRICE CHART: APPROACHING KEY 1.1300 LEVEL
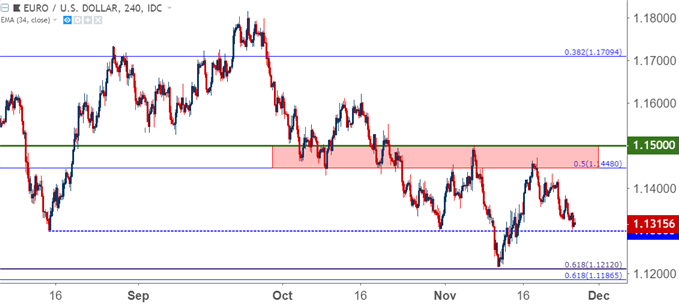
Chart prepared by James Stanley
US DOLLAR BACK ABOVE 97.00 AS BULLS BUY PULLBACK
This week opened with the US Dollar softening off of the 97.00 level that helped to set resistance to close last week; and this isn’t the first time in November that we’ve seen a similar such occurrence, as an early-month weekend-gap beyond this level laid the groundwork for a bull trap scenario.
But after prices ran all the way down to the 96.00 level last week, buyers have returned and continued to push higher on the chart. This continues the bullish trend-line/channel that’s now been in play for more than two months, with initial support settling in around the September FOMC rate decision.
US DOLLAR DAILY PRICE CHART: TWO MONTH BULLISH TREND CONTINUES
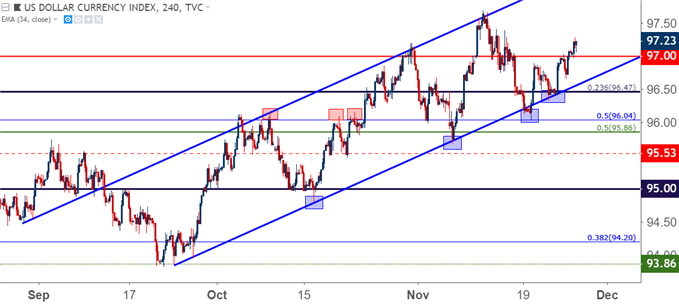
Chart prepared by James Stanley
The complication with bullish strategies in the US Dollar at the moment is the fact that the currency feels very stretched above the 97.00 level. This can also be combined with the fact that USD-strength has been very unevenly distributed of recent, with EUR/USD and even GBP/USD showing this very clearly; while pairs like AUD/USD and NZD/USD haven’t reflected that as well. Bullish items remain on both Aussie and Kiwi, and this can keep the door open for a diversified approach to the US Dollar: Looking for strength against weak currencies such as the Euro or Pound; while hedging for weakness against currencies that have shown a bit more strength, like AUD or NZD.
US DOLLAR HOURLY PRICE CHART: TESTING A PREVIOUSLY DIFFICULT AREA FOR BULLISH CONTINUATION
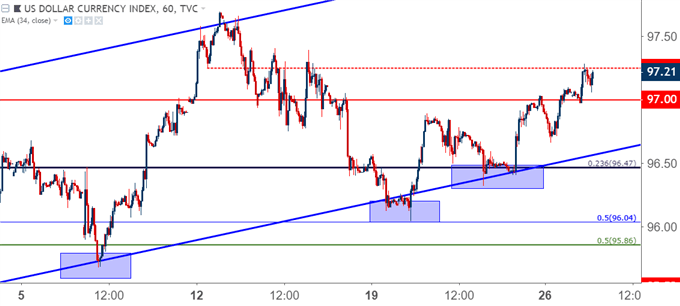
Chart prepared by James Stanley
GBP/USD CATCHES SUPPORT AT LONG-TERM TREND-LINE
GBP/USD sank down to a fresh weekly low to start this week; but support isn’t done yet as buyers showed-up off of a key trend-line projection. This trend-line can be found by connecting the flash crash low in October of 2016 to the March 2017 swing-low. This trend-line projection last came into play two weeks ago, when Brexit-mayhem was hitting fever pitch, and this helped to arrest the declines in GBP/USD after the unexpected resignation of Brexit Minister, Dominic Raab.
GBP/USD DAILY PRICE CHART
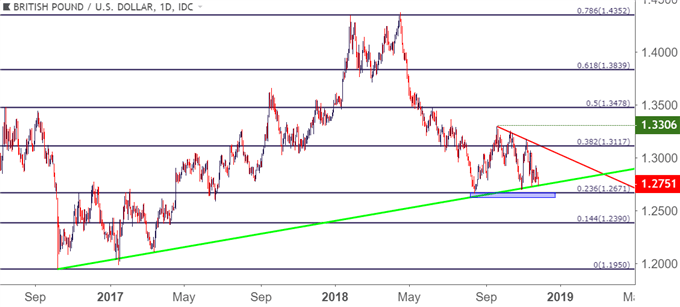
Chart prepared by James Stanley
This can be a difficult area to push short-side trend strategies. For those that do want to sell the pair, there are two possible routes of interest: Either a pullback to find resistance at prior support and given early-week price action, that could be looked for around the 1.2800-handle. Or, alternatively, traders can look for short-side breaks of the November low around 1.2725 to open the door for breakout approaches down to the Fibonacci level at 1.2671. Perhaps more attractive is standing on the sidelines until prices can pose some form of a longer-term directional move.
GBP/USD HOURLY PRICE CHART: RESISTANCE POTENTIAL AT PRIOR SHORT-TERM SUPPORT
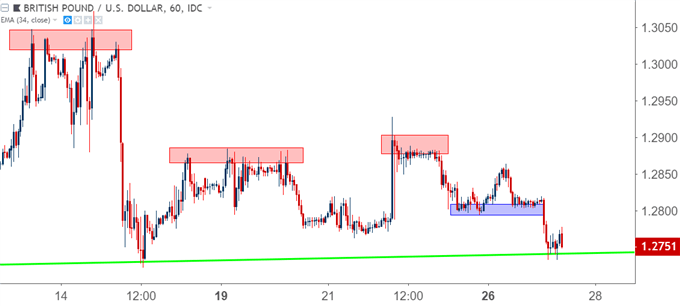
Chart prepared by James Stanley
NZD/USD TESTING FALLING WEDGE RESISTANCE
I’ve been following NZD/USD for the past month for USD-weakness, and despite the fact that the US Dollar has punched up to fresh yearly highs this month, NZD/USD has continued to show strength. The past week has seen a bit of pullback from fresh four-month highs, and that’s taken the shape of a falling wedge pattern. This is being seen slightly different by my colleague, Michael Boutros, who’s looking at this as a bull flag formation. But, both patterns point to higher prices and the resistance portion of that wedge is now coming into play.
NZD/USD HOURLY PRICE CHART: FALLING WEDGE AFTER FRESH FOUR-MONTH HIGHS
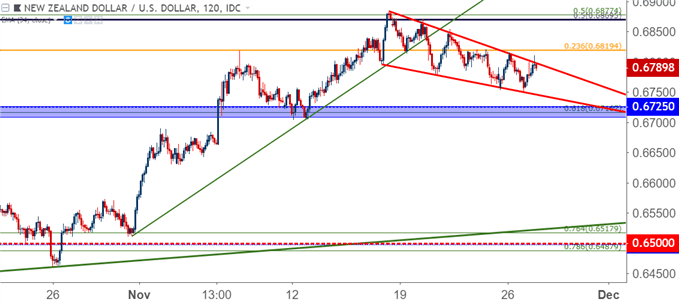
Chart prepared by James Stanley
AUD/USD HOLDS ABOVE KEY SUPPORT ZONE
Another falling wedge had come into play as the November open neared, and this is taken from AUD/USD after sellers began to slow at the lows last month, showing respect for the .7000 psychological level. This brought on an eventual push to fresh three month highs; after which buyers have slowed the approach with price action settling back towards a key area of support.
The area of support in question comes from two long-term Fibonacci levels resting at .7185 and .7205. This support zone has thus far held up multiple pullback so far this month, and a continued hold above support can keep the door open for bullish strategies in the pair.
AUD/USD DAILY PRICE CHART
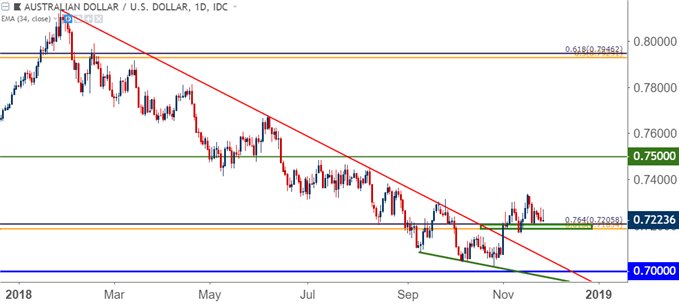
Chart prepared by James Stanley
USD/CAD WITH ANOTHER TREND-LINE BOUNCE
On the long side of the US Dollar, I began looking at USD/CAD a couple of weeks ago. The pair had come into a confluent area of support, as taken from a Fibonacci level and a trend-line projection around the 1.3132 area on the chart; and since then buyers have come back into the pair for another trend-line bounce around a key area of prior resistance.
For USD-strength strategies, this may be one of the more attractive candidates currently out there, as both Euro and Sterling have existential headline-driven themes that could muddy the water. USD/CAD, on the other hand, has been displaying a rather clean technical backdrop over the past couple of months as this bullish trend has continued to drive.
USD/CAD FOUR-HOUR PRICE CHART
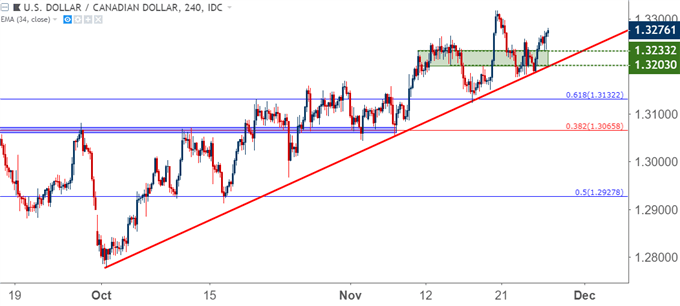
Chart prepared by James Stanley
Disclosure: Do you want to see how retail traders are currently trading the US Dollar? Check out our IG Client Sentiment ...
more

