
EUR/USD Holds Resistance, AUD/USD In Focus Ahead Of RBA
US EQUITIES HOLD KEY RESISTANCE AFTER ANOTHER STRONG NFP
Last week ended with a strong headline NFP print as the US economy added more than 300k jobs for the month of January. This was partially offset by a rather large revision to the prior month to go along with a miss on Average Hourly Earnings; but given that this print was released on the heels of another set of dovish hints from the Federal Reserve, the backdrop appeared accommodative for an extension of the 2019 risk rally. As the door has opened into February, both the Dow and S&P 500 are holding resistance at an interesting spot on the charts, as taken from 78.6% Fibonacci retracements produced by the December sell-offs in each market. The big question is for how long this resistance might hold, and whether this can produce a pullback deep enough to re-open the door for bullish trend strategies in US stocks.
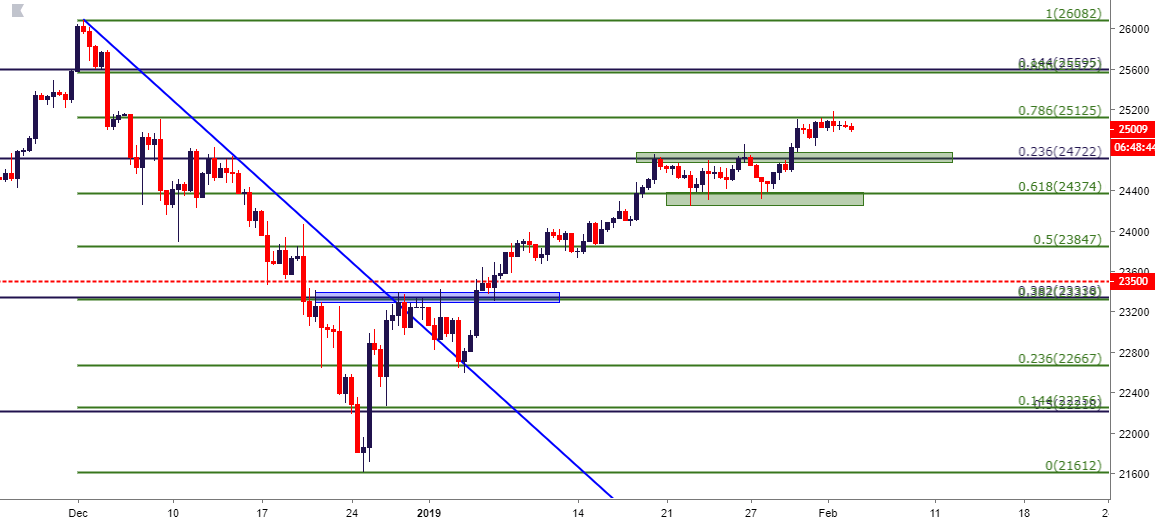
Below is the four-hour price chart of the Dow Jones Industrial Average, with a focus on two different areas of support potential. The nearer zone around 24,722 is the 23.6% retracement of the post-Election move in the index; and a little lower is the 61.8% marker of the December sell-off, a level that’s already been tested multiple times for higher low support in the Dow. If this level cannot hold, that bullish bias may come into question but, until then, a continued build of higher-low support can keep the door open for topside strategies.
DOW JONES EIGHT-HOUR PRICE CHART: 78.6 RESISTANCE HOLDS THROUGH NFP
(Click on image to enlarge)
THIS WEEK’S ECONOMIC CALENDAR
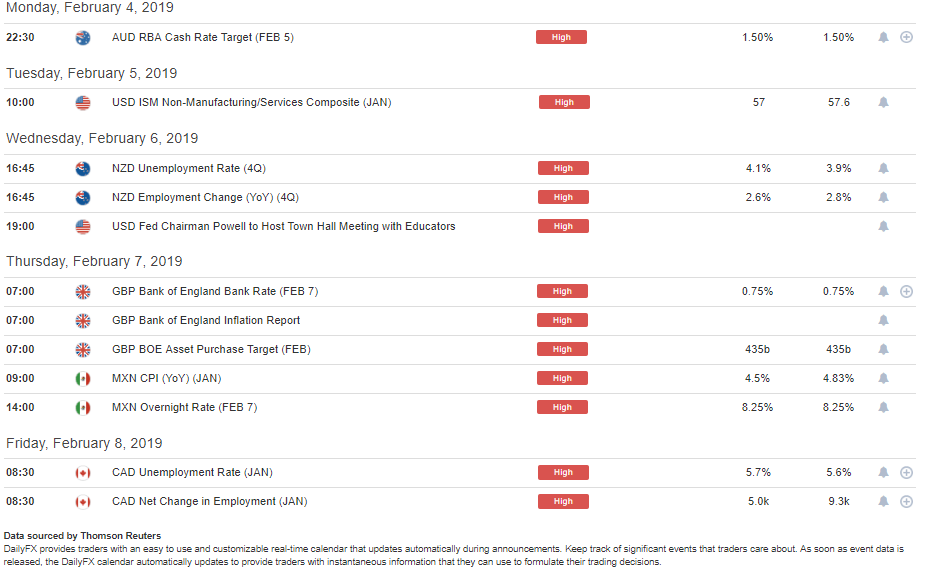
This week brings a number of high-impact releases on the economic calendar with Central Bank rate decisions set to take place out of Australia, Mexico, and the UK. On the data front, US ISM is set to be released tomorrow morning and New Zealand employment figures are on deck for Wednesday. Mexico CPI is released on Thursday morning, ahead of the Banxico rate decision taking place later in the day; and the week closes with a look at Canadian employment numbers due to be unveiled on Friday morning.
DAILYFX ECONOMIC CALENDAR: HIGH-IMPACT EVENTS FOR THE WEEK OF FEBRUARY 4, 2019
(Click on image to enlarge)
EUR/USD HOLDS KEY RESISTANCE, MEAN REVERSION CONTINUES
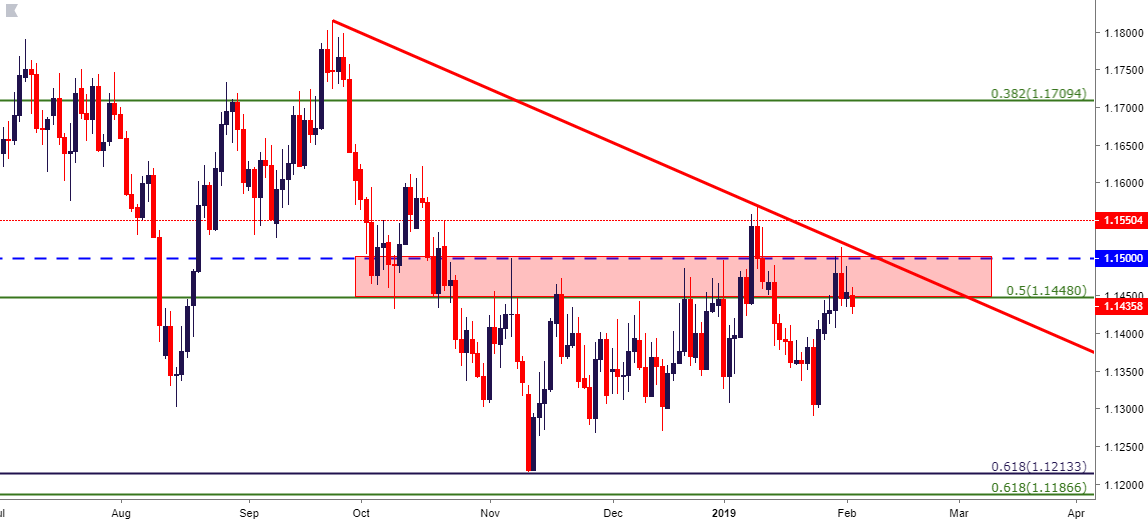
After spending the first month of Q4 in the midst of a fairly concerted down-trend, EUR/USD has been beset by back-and-forth price action for much of the past three months. Over that time, there have been multiple tests of the resistance zone that runs from 1.1448-1.1550 but, as of yet, buyers have been unable to leave behind this key region on the charts. Last week saw yet another resistance test in this area, and this comes three weeks after the false breakout that topped-out at 1.1550.
With February opening to a less threatening backdrop than what was seen around last month’s open, will bulls have the ability to finally push-forward above this key area of resistance?
EUR/USD DAILY PRICE CHART
(Click on image to enlarge)
AUD/USD PULLS BACK AFTER HIGHER-HIGHS, LOWS: WILL BUYERS SHOW SUPPORT AT PRIOR RESISTANCE?
The year opened in a very negative manner around the Australian Dollar: The currency put in a fast downside run through the .7000 psychological level and all the way to .6750 in the opening days of the New Year. Since then, however, has been the development of a far different tone, as buyers have continued to push prices higher with a series of higher-highs and higher-lows, crossing above a big area of resistance in the process that runs from .7185-.7205. Each of those levels are derived from longer-term Fibonacci studies and have had an impact with near-term price action over the past few months. In November, this area helped to hold support through multiple tests during the month. Sellers took control in mid-December to push prices down to fresh lows, after which that zone became resistance over a couple of different tests.
But with bulls having re-grabbed control of the matter, the big question as tonight’s RBA rate decision approaches is whether they’ll be able to hold the lines of higher-low support. Below .7185-.7205 is another potential support zone from .7125-.7150, and below that is the one-month low at .7075.
AUD/USD EIGHT-HOUR PRICE CHART
(Click on image to enlarge)
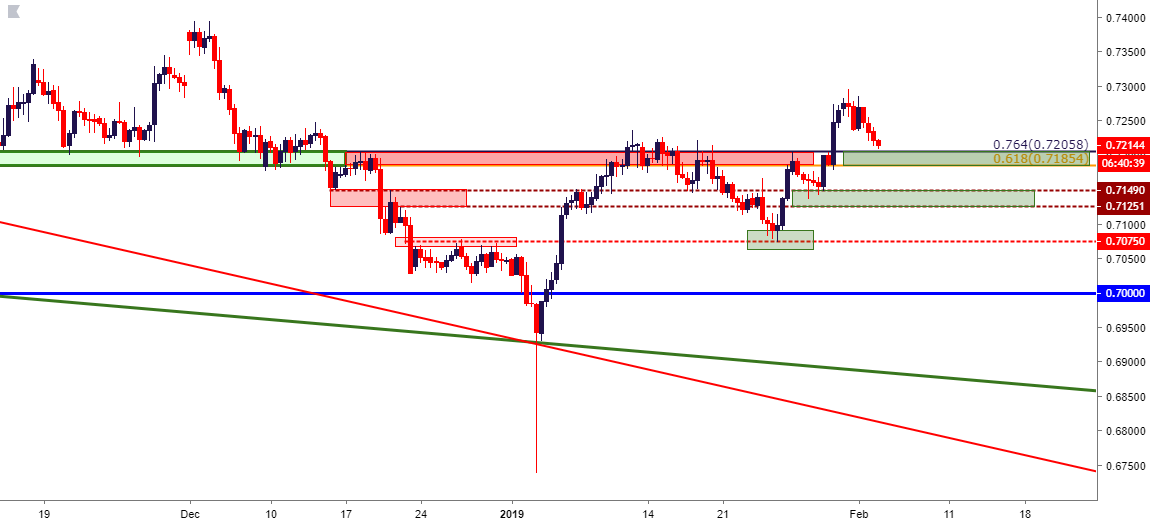
Chart prepared by James Stanley
Disclosure: Do you want to see how retail traders are currently trading the US Dollar? Check out our IG Client Sentiment ...
more

