
EUR/USD Bullish Bounce At 1.15 Round Level Support
EUR/USD
4 hour
(Click on image to enlarge)

Source: Admiral Markets MT5 with MT5SE Add-on EUR/USD motive wave – accessed 3 October 2018 at 8:30 AM GMT
The EURUSD currency pair made a bullish bounce at the support trend line (green) and the round level of 1.15. The bullish reversal could indicate the end of a potential wave A (purple) and the start of a wave B (purple), which could lead to a larger ABC pattern within wave X (pink). The continuation of the wave B seems more likely if candlestick patterns are able to break above the resistance trend lines.
1 hour
(Click on image to enlarge)
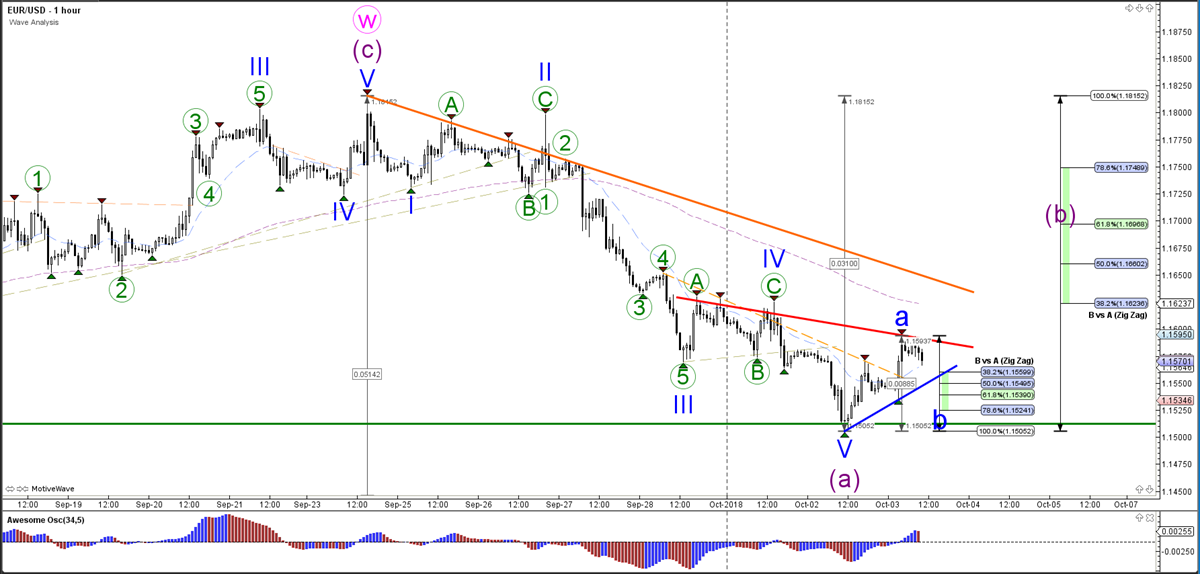
Source: Admiral Markets MT5 with MT5SE Add-on EUR /USD motive wave – accessed 3 October 2018 at 8:30 AM GMT
The EUR/USD currency pair's bullish bounce could indicate a wave A (blue) of a larger ABC (blue) pattern in wave B (purple). A bearish retracement could lead to a bounce at the Fibonacci levels of wave B vs A, but a bullish breakout is needed to confirm this potential pattern. A break below the 100% Fib invalidates the ABC wave pattern.
Daily
(Click on image to enlarge)
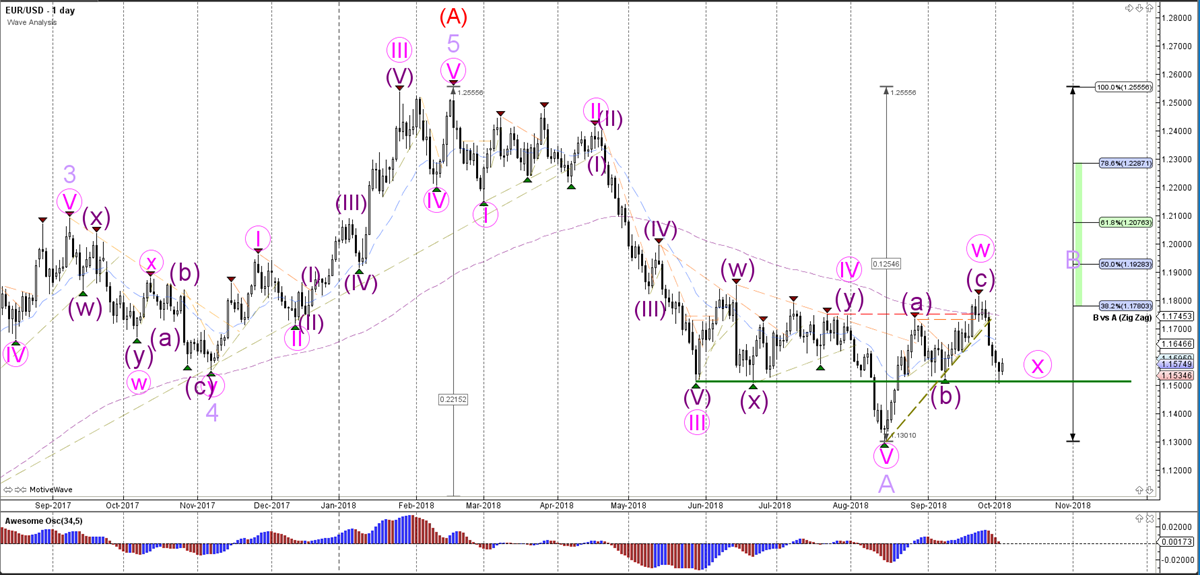
Source: Admiral Markets MT5 with MT5SE Add-on EUR /USD motive wave – accessed 3 October 2018 at 8:30 AM GMT
The EUR/USD currency pair is showing a potential larger WXY correction (pink) within wave B (purple). A break below the bottom at 1.13 could indicate a change of wave patterns.
Disclaimer: The opinions in this article are for informational and educational purposes only and should not be construed as a recommendation to buy or sell the stocks mentioned or to solicit ...
more

