
EUR/USD Bullish ABC Testing Key Fibs For Bearish Reversal
The EUR/USD built 5 bearish waves as expected. But is it enough to create a full bearish reversal?

This article examines why we expect the uptrend to turn into a strong bearish price swing. Let’s start.
Price Charts and Technical Analysis
(Click on image to enlarge)
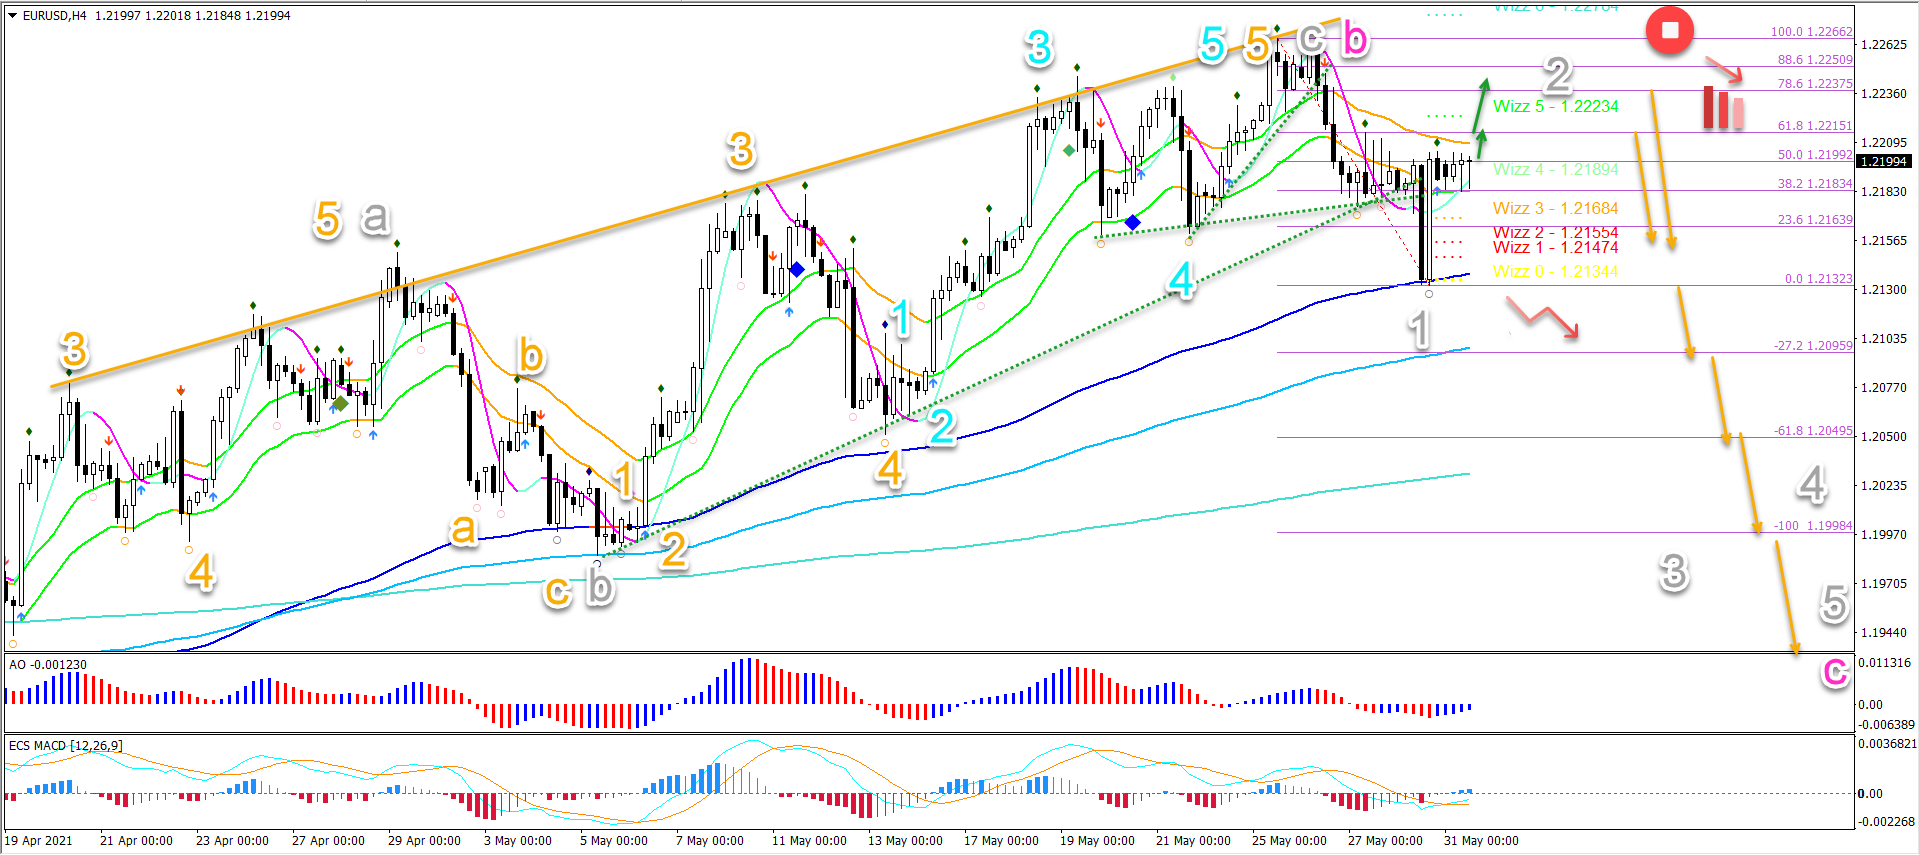
The EUR/USD is testing a heavy resistance zone on the daily chart (top). This previous top is expected to create a bearish price swing for a wave C (pink). Besides the strong resistance, there are also chart and Elliott Wave patterns that indicate a reversal:
- The Elliott Wave patterns are indicating the end of the wave B (pink) and the start of the wave C (pink).
- There was also a rising wedge reversal chart pattern that already broke below the support trend lines (dotted green).
- The bearish 5 waves (orange on 1H chart) is probably a wave 1 (orange).
- The current bullish bounce is expected to be a wave 2 (grey).
- The wave 1-2 (grey) outlook remains valid as long as price stays below the previous top. A bullish break invalidates it (red circle).
- A bearish bounce below the top (orange arrows) could start the wave 3 (grey) lower.
- A lengthy sideways correction, however, could indicate a different corrective pattern rather than a bearish reversal.
- A break below the -61.8% Fibonacci target usually indicates and confirms a wave 3 (grey) pattern.
- The main targets are the Fibonacci levels as indicated in the 4 hour chart. The -161.8% Fib target is located at 1.1916. Price action could decline to test the daily bottom around 1.17-1.1750.
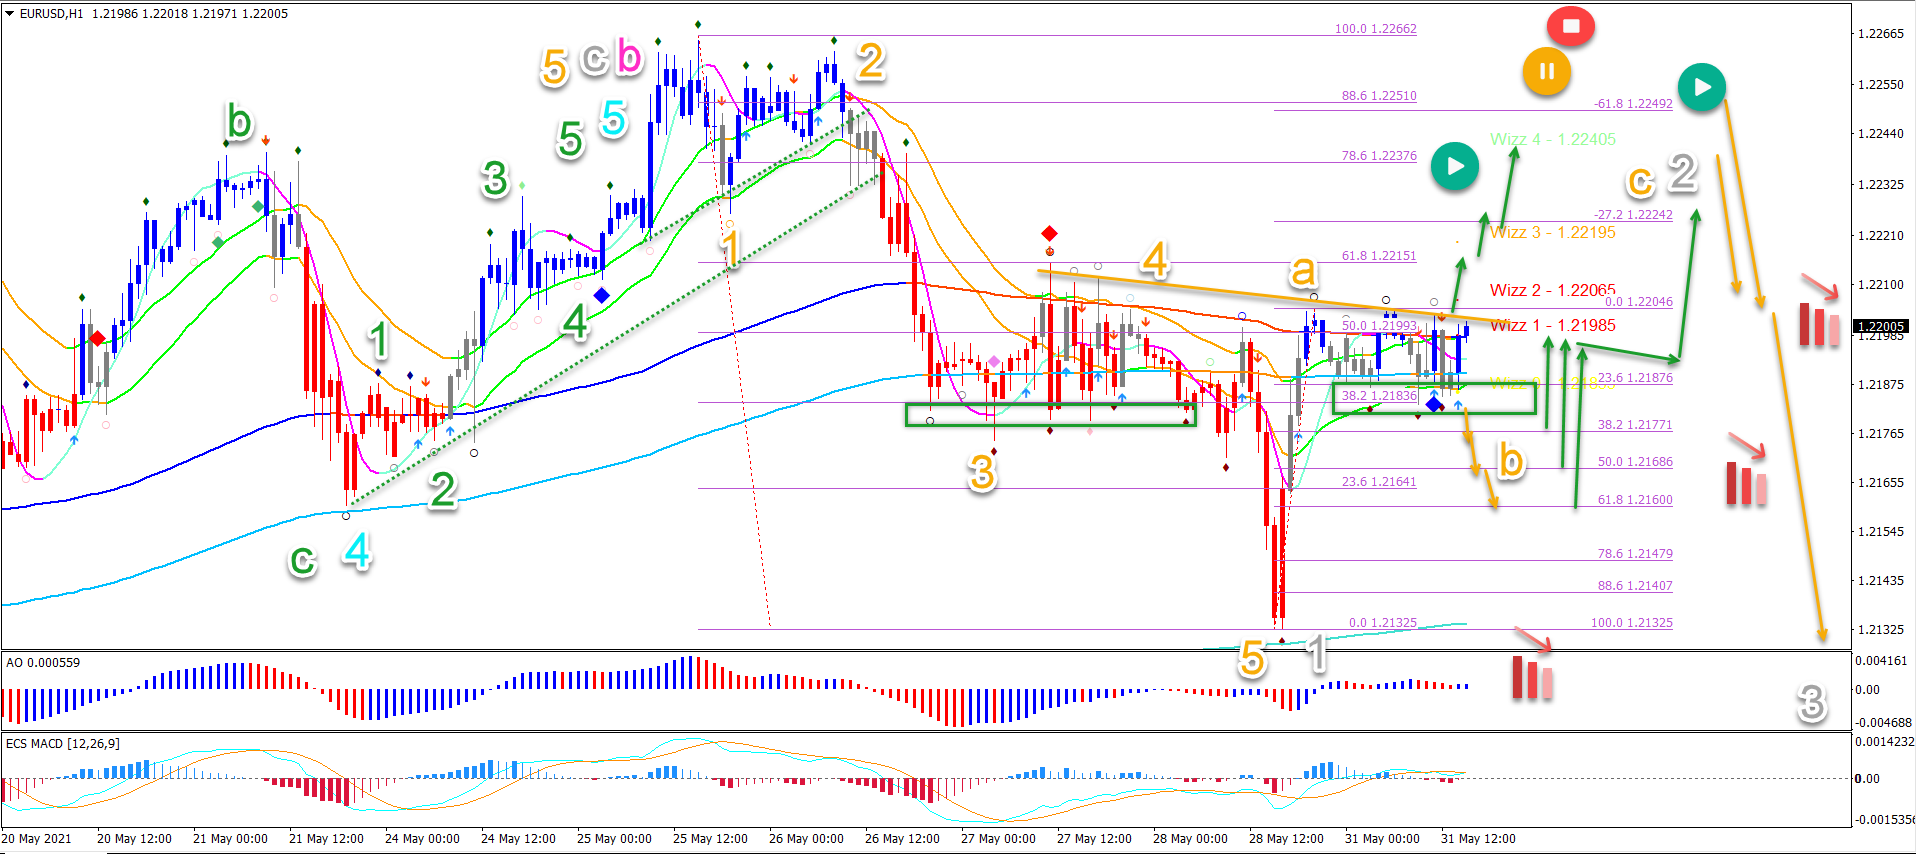
On the 1 hour chart, price action seems to have completed 5 bearish waves (orange) in wave 1 (grey):
- The current bullish price action is probably a wave A (orange).
- The sideways correction seems to be a wave B (orange).
- The wave B is getting support from the previous bottoms (green boxes).
- A bullish breakout (green arrows) above the local resistance (orange) could indicate a wave C (orange) in wave 2 (grey).
- A bearish breakout (orange arrows) below the support (green) could indicate a deeper wave B (orange).
- A bearish bounce could confirm the downtrend. Also a break below the bottom confirms the downtrend.
- A break above the top invalidates it (red circle).
(Click on image to enlarge)
Disclaimer: CFDs are complex instruments and come with a high risk of losing money rapidly due to leverage. On average around 80% of retail investor accounts loose money when trading with high ...
more

