
Eurozone Banks Ready To Implode, Part 1: It’s Bad, You Know
This article represents Part 1 on the comparative performance of U.S. and European banks since 2001. (The full paper is available for download from the Social Science Research Network: SSRN. The alternative title refers to the R.L. Burnside song It’s Bad, You Know, featured in an episode of The Sopranos).
Taking a longer-term view, I find that U.S. banks earned significantly larger stock returns than their European counterparts in the post-crisis years, accompanied by higher rates of revenue and loan growth, lower risk, and superior profitability and loan quality. European banks, on the other hand, remain trapped in a downward spiral of negative revenue and loan growth, decreasing profitability, increasing impaired and nonperforming loans, and are sporting market value to debt ratios that suggest imminent insolvency.
Following are my findings about revenue growth and loan portfolio quality. The next article will cover profitability, capital ratios, interest on deposits and payouts to shareholders. Let’s start with stock returns since April 2009, shown in the graph below.

We know that both corporate profit growth and key macro drivers have been far stronger in the U.S. post-crisis, thus we see the S&P 500 (+150%) outperforming the Euronext 100 (+65%), and the average returns of the U.S. banks (+232%) significantly higher than their European counterparts (+80%). Both sets of banks have had difficulty growing their total revenue post-crisis, as shown in the graph below.

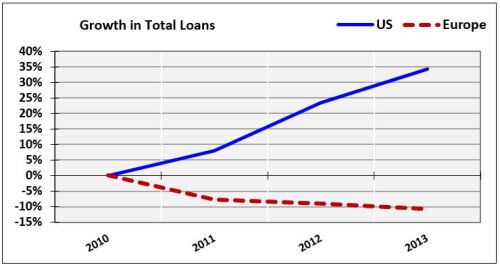
If you follow David Stockman on TalkMarkets, you are familiar with his many excellent articles regarding peak debt around the world. Despite rocky revenue growth, U.S. banks grew their loan portfolios every year post-crisis, for a total gain of +35% from 2010-2013. Over the same period, Eurozone banks’ loan portfolios shrunk by 10%:
Whether growing or shrinking, the quality of banks’ loan portfolios is a critical issue. The following graph shows the percentage of each set of banks’ loans classified as impaired, restructured or nonperforming since 2001:

U.S. banks’ troubled loans have remained stuck at around 7% post-crisis. In Europe, however, the percentage of troubled loans grows every year, approaching 18% by the end of 2013. If you don’t find this sufficiently disturbing, consider that these troubled loans do not take sovereign debt (the debt of other nations) into account, because repayment of these loans is “guaranteed” (Greece has not yet had to sign over the Parthenon as collateral, but the global banking crisis still has room to run, so stay tuned.)
The next graph shows banks’ coverage ratios, which is the amount of “loan loss allowances” relative to impaired loans that banks set aside on their balance sheet in the event of outright loan defaults. After a loan default, allowances are reduced and transferred to the income statement and expensed against bank revenues (as “provisions for loan losses”).

In our new centrally-planned world, banks have adopted a “What, me worry?” attitude about their troubled loans. Despite higher levels of impaired loans, both U.S. and European banks are setting aside much lower relative allowances for loan losses. Here we see the effect of a zero interest rate policy (ZIRP) — why declare a loan as “nonperforming” when it can be rolled over again and again at a short-term interest rate that is essentially zero? What could go wrong?
Next installment will cover banks’ profitability, capital ratios, interest paid on deposits and payouts to shareholders.
Data provided by S&P’s Capital IQ.
>> Continue to Eurozone Banks Ready To Implode, Part 2: In Search Of Solvency


If banking in America is, according to the author, so much prosperous than their European conterparts how does he explains the increasing number of ghost towns all over the USA
I would say you are overstating, exaggerating, and simplifying the situation.
Do you have a reference/link to the 'ghost town'? Not aware of an increase lately.
Traitor of the nation. Today we are in a step from an abyss. We can face a problem much worse, than in 1929. Today it becomes clear that the country is sacrificed to political ambitions of the lodger number 10. Growth of negative trade balance of the country increases daily. Having entered game between the White house and the Kremlin we sacrificed the economy. Recession will be terrible. Instability of the currency market is ready to cause system bank crisis. Whether the Office is capable to answer to Residents of the United Kingdom for deeds. And in whose interests David acts. Who knows? Lismus Ikvik.
Thanks for an excellent article and for tipping me off to David Stockman. I hadn't realized I could find his material on TalkMarkets too!