Europe Opens Mixed Ahead Of ECB & US Q3 GDP
Europe Opens Mixed Ahead of ECB & US Q3 GDP
European stocks are heading out of the blocks in a mixed fashion after yesterday’s bloodshed. Whilst Asian stocks fell overnight the fall was more contained than Wall Street & Europe’s sharp declines as Asia’s more upbeat outlook soothed investor fears.
Quite simply Asian nation broadly managed to bring covid under control with the first wave. A second wave hasn’t struck like it has in Europe and the US. Consequently, the economic outlook in Asia is more upbeat. There could be some softness surrounding exports, but domestic demand is expected to remain robust.
European bourses & Wall Street took a hammering as covid cases spiked and national lockdowns were announced for the Eurozone’s largest economies, Germany & France. The question is whether the US will follow suit as cases continue to surge stateside.
Fear gauge jumps
The volatility index, also known as the fear index, jumped on Wednesday to its highest level since June suggesting that the markets could be in for another wild ride as the second wave of covid takes grip, before the economies have even fully recovered from the first wave.
ECB - not if when?
Attention will now turn towards the ECB’s monetary policy announcement. With covid cases on the rise and the PMIs showing business activity in contraction the ECB are expected to add more to support the economy. The question now is not if but when. December had been earmarked by the market for additional stimulus. The big question is whether the new national lockdown announcements will prompt the ECB to take pre-emptive action today. The Euro has been skidding lower across the week in anticipation of a dovish meeting.
Ahead of the ECB announcement, investors will look towards German unemployment and Eurozone consumer confidence data.
US Q3 GDP
US GDP for the third quarter is expected to show 31%, after contracting -31.4% on an annual basis in Q2. This would be a record breaking rebound after a record-breaking contraction. However, this does not mean by any stretch of the imagination that the economy is back to where it started. Let’s not forget that 50% of 100, is significantly larger than 50% of 50. The US is expected to see a 3% gap between Q2 & 3 which sounds small but equates to the worst of the 2007 -9 recession.
What this data will prove is that the US is in desperate need of additional stimulus. However, any new rescue package looks unlikely prior to the election.
Looking ahead earnings from some of the world’s largest companies such as Apple, Amazon, Alphabet and Facebook are due to report.
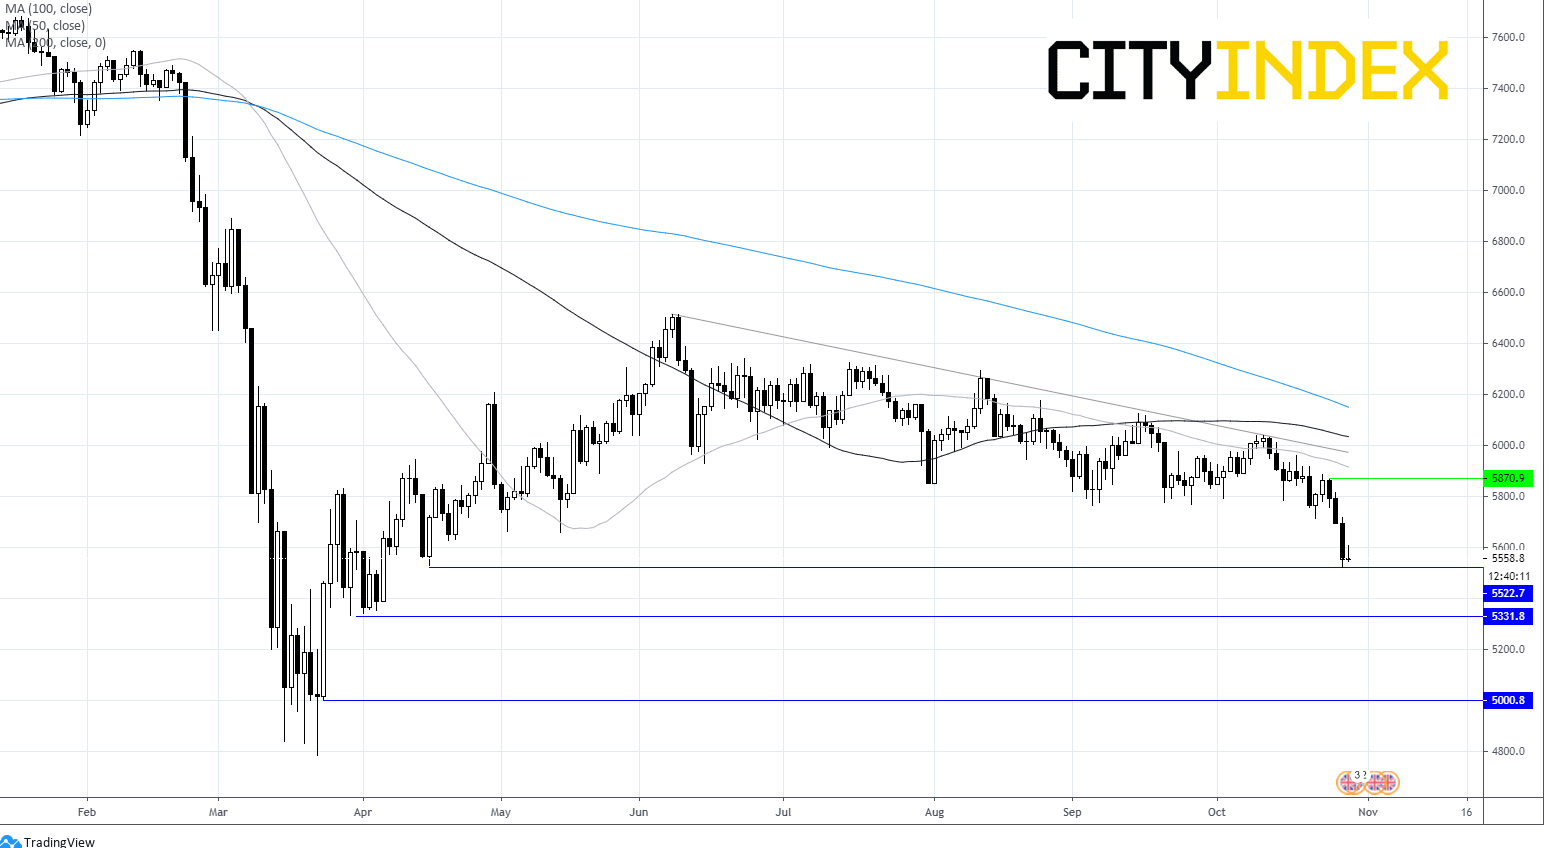
FTSE chart
FTSE trades below 50, 100 and 200 SMA on daily chart and below its descending trendline in place since early June – a bearish chart. Horizontal support held at 5530 (16th April swing low). A breakthrough here could open the door to 5330 (low 1st April).
On the flipside, resistance can be seen at 5875, (26th Oct).