
Estimating Fair Value For The 10-Year Treasury Yield, Part II
<< Read More: Estimating Fair Value For The 10-Year Treasury Yield
Earlier this month, I reviewed a model that estimates a theoretical level for the world’s most-important interest rate: the 10-year Treasury yield. In today’s follow-up, let’s consider a second model for additional context.
The goal in this series is to select several models with an eye on combining the estimates. A long line of literature demonstrates, rather convincingly, that one of the most (perhaps the most) reliable methodology for improving results with forecasting and estimating is drawing on insights from several modeling applications.
The power of combination forecasts assumes that the models are independent and in some sense complimentary. Taking the average of ten models with essentially the same methodology would be pointless. With that in mind, let’s add what we’ll call the Frontier model to the mix.
The idea for this approach was outlined in 2018 in a research note (“Frontier’s Quantitative ‘Fair Value’ Bond Models”) from Frontier Advisors. The paper outlines a parsimonious model with three inputs: 1) US unemployment gap (difference between the unemployment rate and CBO’s estimate of the non-accelerating inflation rate of unemployment); 2) volatility of 10-year yield; and 3) momentum of 10-year Treasury yield.
The author explains that “we considered using market derived measures of inflation expectations but, due to their shorter history (around a decade once sufficiently liquid), decided against this.”
The correlation of the unemployment gap with nominal growth, which itself contains an inflation component, does provide us with some comfort. As for the other two variables, their inclusion captures risk on/risk off behaviour and investor flows. During periods of market stress, realized volatility tends to pick up rapidly, with yields compressing as investors seek shelter in the UST market. Momentum likely picks up investor flows and other transitory factors the market focuses on from time to time.
On that basis, the Frontier model offers a complimentary alternative to the Shevlin model outlined previously. Recall that the Shevlin model uses real US economic growth (GDP) and inflation (CPI) as inputs.
Note that I’m making certain assumptions about how to process the three variables for the Frontier model – assumptions that almost certainly differ from Frontier’s number crunching. Accordingly, the results are inspired by Frontier’s research note but should not be considered a flawless replication of the firm’s estimates.
Coding the results in R produces the following history:
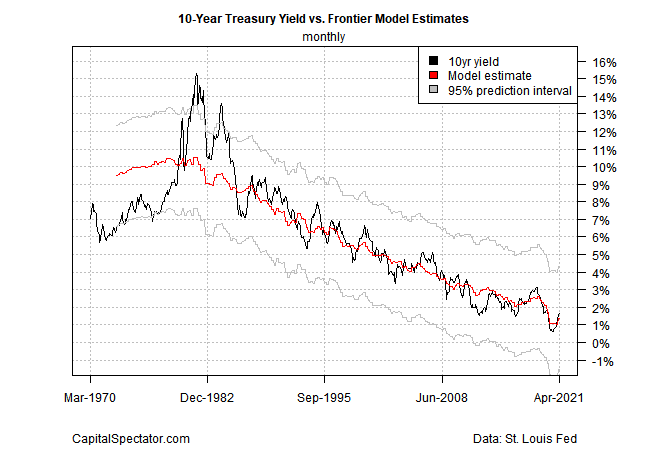
The model has a rough time with the surge in volatility in interest rates in the late-1970s and early 1980s, but the estimates become more reliable as the years unfold. Presumably this is partly due to accumulation of more data history that informs the modeling. A calmer, trending market in recent years doesn’t hurt. Note that the current estimate suggests that the 10-year rate is about right, which implies that the recent rise in this Treasury yield has peaked. By contrast, the Shevlin model offered more scope for a higher yield in the near term.
Meantime, the history of the Frontier model’s residuals certainly indicate that the estimates have improved through time.

The results imply that the Frontier model excels when rates are trending. By contrast, the Shevlin model appears to be somewhat more useful for navigating turning points in rates, although these insights are probably marginal at best.
In any case, each model tackles the challenge of estimating fair value for the 10-year with a different set of assumptions using different data sets. On both fronts, the assumptions are reasonable. But like every model, some degree of noise intervenes. The goal is to aggregate different models with different types of flaws in the pursuit of estimates that more reliable — less noise, more signal — than available in any one model.
As the British statistician George E. P. Box famously observed, “All models are wrong, but some are useful.” We might revise that to reason that all models are wrong, but forecasting is less wrong when estimates are derived from several models.
In a future post, I’ll add other models to the mix and start reviewing how the combination forecasts stack up against the individual model estimates. If history is a guide, the results should be encouraging.
>> Read More: Estimating Fair Value For The 10-Year Treasury Yield, Part III
Disclosures: None.


