
Equity Forecast For Dow, S&P 500, DAX And FTSE For Next Week
S&P, Dow, DAX, FTSE Talking Points:
- S&P 500 Price Analysis: Wary as Highs Near, Dow Struggles to Keep Up.
- Dow Pulls Back From Five-Month Highs Ahead of US Inflation.
RISK AVERSION BEGINS TO REAR ITS HEAD IN GLOBAL STOCKS
Risk aversion showed up in global markets in the latter portion of this week, and that theme appeared to be unevenly distributed amongst the world’s equity bourses. In Europe, the DAX saw heavy offers on the back of fears around contagion in the European banking sector as the situation in Turkey continues to evolve. That weakness has also filtered into the FTSE 100 over the final two trading days of this week, but this turn took place around a big level that may have more to do with the sell-off than concerns around Turkey, although it would be far too early to say that definitively.
In the US, we saw pullbacks in both the S&P 500 and the Dow Jones Industrial Average - but at this point, those moves appear to be more of a short-term correction after the July and August bullish breakouts rather than tradeable tops.
S&P 500 PULLS BACK FROM FRESH SIX-MONTH HIGHS
The S&P 500 started off the week with strength, moving up to another fresh six-month high and making a fast approach at the all-time-high that was set in late January. Wednesday, however, is when prices started to pull back and that move has lasted into the end of the week. But – given the longer-term structure behind the S&P, the up-trend remains and bullish continuation strategies can continue to be attractive, particularly as we stay above the August swing-low of 2790. The forecast for the S&P 500 will be set to bullish for next week.
S&P 500 DAILY PRICE CHART
(Click on image to enlarge)
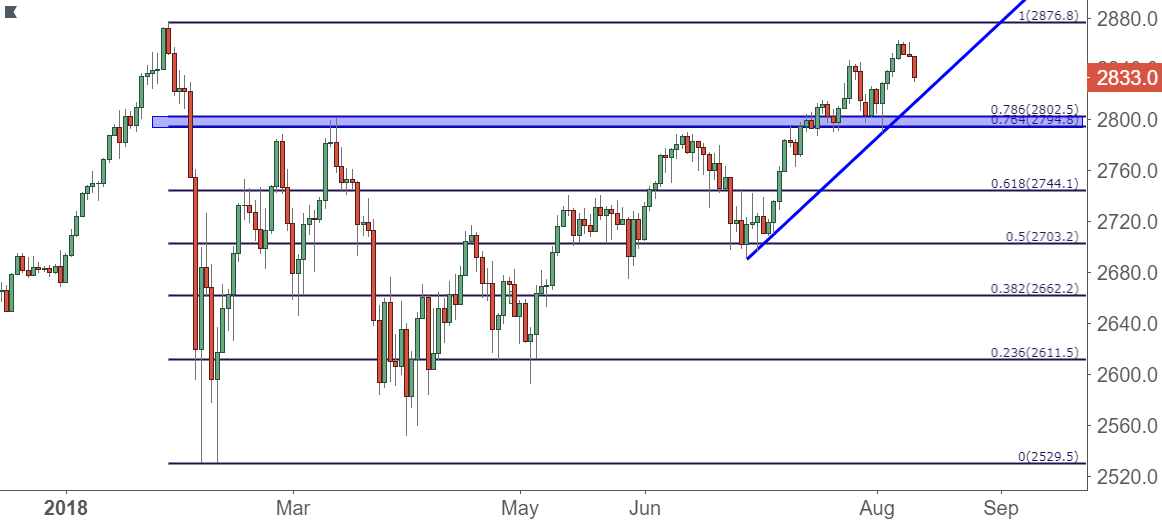
Chart prepared by James Stanley
DOW JONES STAGES DEEPER PULLBACK
The turn in the Dow has been a bit deeper than what’s shown in the more broad-based S&P 500, and prices have already fallen below the near-term support zone that we had looked at yesterday. With a bit of short-term resistance showing on the underside of that prior support zone, the door would appear open for a deeper short-term sell-off, and this exposes another area of longer-term support potential around the 25,000 psychological level.
While the longer-term bullish structure does remain, the forecast on the Dow Jones will be set at neutral for the week ahead.
DOW JONES DAILY PRICE CHART
(Click on image to enlarge)
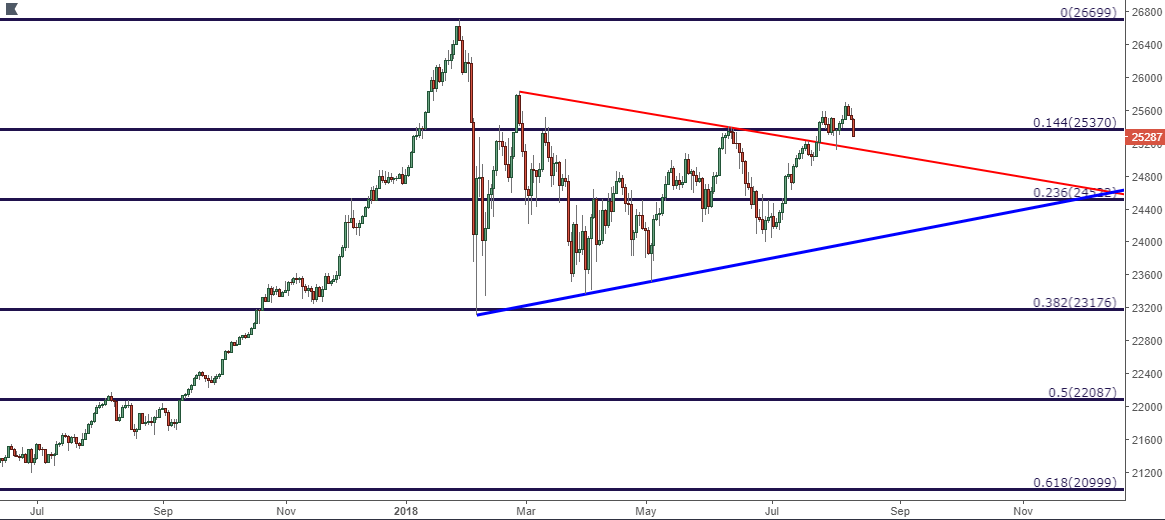
Chart prepared by James Stanley
DAX CLOSES WEEK ON A BEARISH NOTE, APPROACHES LONG-TERM TREND-LINE
The DAX was pushed down to fresh monthly lows as we wound down this week, in large part as worries began to circulate about contagion in European banking from exposure to Turkey. While this is still a relatively new theme or driver, it does have the potential to produce a deeper sell-off in risk assets that may be negatively impacted by the continued development of the situation.
DAX price action is fast approaching a trend-line that’s been in play since early-2016, and this could provide a bit of context around this week’s sell-off. If next week produces a support test coupled with a return of buyer support, the door could re-open to bullish continuation strategies. But – if we do trade through this trend-line and if we do sell-off to fresh lows, bearish approaches could soon be favored.
For now, we’re setting a neutral forecast on the index for next week until more clarity can be had around European contagion or, more to the point, how the DAX will react to another trend-line inflection.
DAX WEEKLY PRICE CHART: APPROACHING TREND-LINE SUPPORT
(Click on image to enlarge)
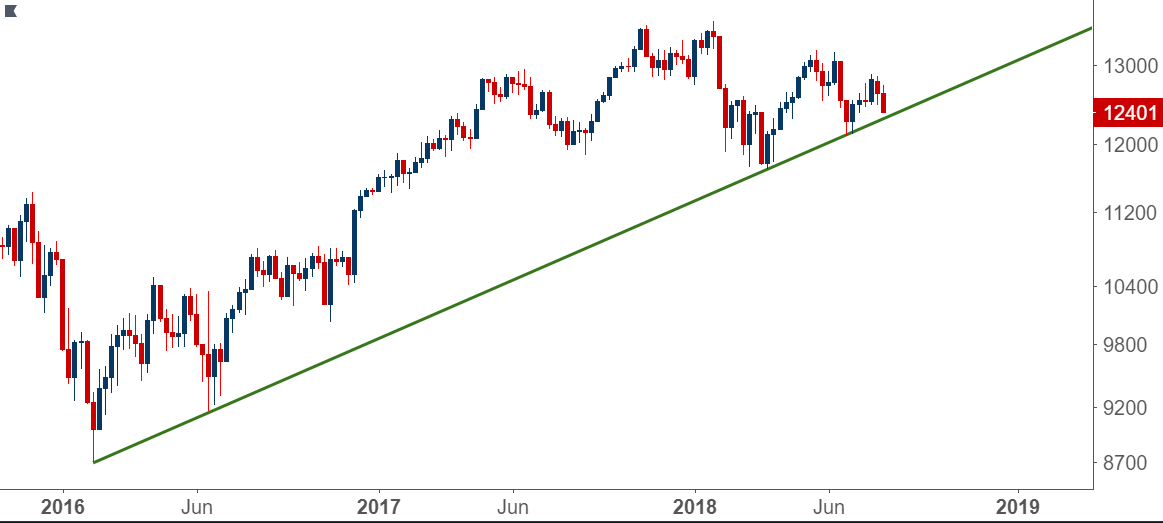
Chart prepared by James Stanley
FTSE 100 FALLS FROM RESISTANCE AFTER ANOTHER FAILED TEST OF HIGHS
Despite the numerous negative headlines that have surrounded the UK economy over the past week, the FTSE100 remains relatively strong. The early portion of this week saw the index push up to a key level around 7775, which is around a prior all-time-high that was set in January of this year. Since that high was set, we did see a test above this area in late-May; but after prices fell-back, sellers continued to populate resistance around 7775. On the other side of price action, a rising trend-line has helped to hold the lows since late-June, and this keeps a bullish overtone around the index.
The forecast for next week will be set to neutral on the FTSE 100.
FTSE100: PULLS BACK FROM ANOTHER FAILED TEST TO SUSTAIN A BREAK ABOVE 7775
(Click on image to enlarge)
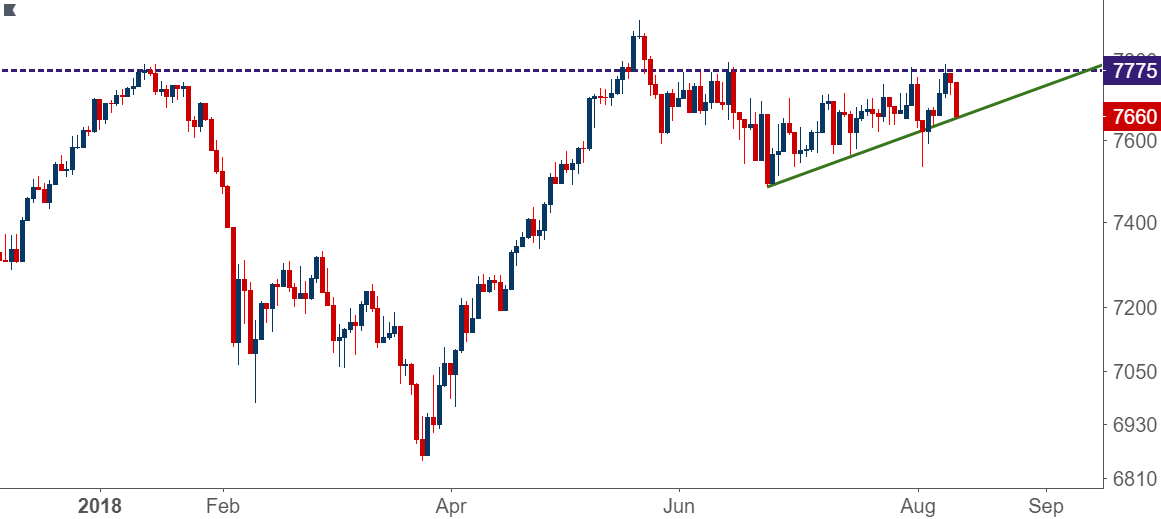
Chart prepared by James Stanley
Disclosure: Do you want to see how retail traders are currently trading the US Dollar? Check out our IG Client Sentiment ...
more

