
Endangered Species: The Self-Employed Middle Class
Including the professional class, perhaps 3% of the workforce is truly independent.
Being self-employed (i.e. owning your own small business that does not require employees) is an integral part of the American Dream. Many start out dreaming of a corner office in Corporate America, but as they move up the ladder, many become disillusioned by the process and the goal: do I really want to spend my life making big-shots even wealthier?
Bureaucracies (government and corporate) are safe sources of employment, but at a cost: they're often soul-deadening.
Many dream of making a living doing something they actually care about, and that often means striking out on your own, i.e. self-employment.
This raises an interesting question: how many self-employed people in the U.S. actually earn a middle class income? Since all the government statistics have a line at $50,000, and $50,000 might support a minimal middle class lifestyle in areas with a low cost of living, let's use $50,000 in annual income as our minimum.
As you might expect, government agencies count jobs and self-employment in different ways, which makes sorting out the numbers difficult. The Bureau of Labor Statistics (BLS), for example, counts two types of self-employed, the unincorporated and the incorporated. The unincorporated may have employees, but typically do not, i.e. they are sole proprietors. The incorporated have employees, starting with the owner, as the BLS counts the incorporated self-employed as employees of their own corporation.
The analysts at Docstoc.com assembled a chart that counts only those sole proprietors, partnerships and corporations with no employees, i.e. the self-employed: The State of US Small Businesses.
They came up with a total number of all self-employed that earned at least $1,000 annually of 22.5 million, of which 3 million were partnerships or corporations. These are overwhelmingly professionals such as attorneys, accountants, physicians, consultants, entertainers, etc.
If we subtract the partnerships and corporations, there are 19.4 million sole proprietors.
For context: there are about 141 million people in the U.S. with some sort of employment according to the BLS: total nonfarm employment.
But this number includes tens of millions of part-time jobs and self-employed earning very little money. According to the BLS, there are about 121 million full-time jobs and 27.3 million part-time jobs.
But how many of these jobs are marginal, i.e. earn less than $10,000 a year? For that, we turn to the IRS data from tax returns (The Social Security Administration also compiles income statistics.)
I prefer the statistics compiled by tax returns, as these numbers are verifiable and precise. There is no seasonal adjustment of tax returns; there is an exact known number of tax returns with taxable income, i.e. net income after credits and deductions.
The IRS site Individual Statistical Tables by Size of Adjusted Gross Income offers a wealth of information that can be downloaded into Excel spreadsheets.
I am referring here to Table 1.1, All Returns: Selected Income and Tax Items for tax year 2012, (the most recent data available) and Table 1.4, All Returns: Adjusted Gross Income, Exemptions, Deductions, and Tax Items for tax year 2012.
If we examine Table 1.1, we find there were about 145 million returns filed, and 93 million had taxable income after credits and deductions. Roughly 46 million earned less than $20,000: 22 million workers earned less than $10,000, 35 million earned less than $15,000, and 46.5 million earned less than $20,000.
While 19.4 million sole proprietors is a big number, it turns out most are side businesses that earn relatively little income. 5.5 million earn less than $5,000 annually, 3.8 million net between $5,000 and $10,000, 5.7 million earn between $10,000 and $25,000, and another 3 million net between $25,000 and $50,000.
Only 4.48 million self-employed earn $50,000 or more, and 3 million of those are partnerships or corporations, i.e. professionals such as CPAs, attorneys, etc. That leaves leaves about 1.5 million people who aren't in the professional class (those with advanced degrees and professional licenses and credentials) who earn a middle class living as sole proprietors.
This is roughly 1% of the workforce of 145 million. It turns out the non-professional self-employed that make enough to maintain a minimally middle class lifestyle are a razor-thin slice of the workforce.
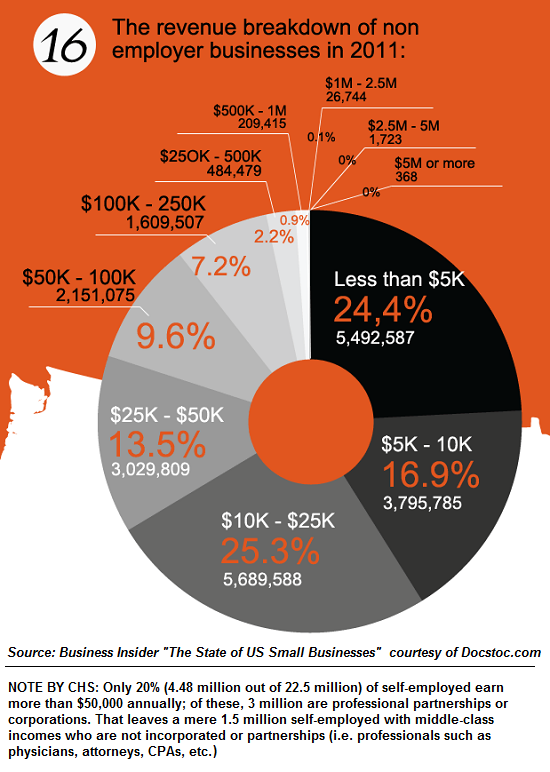
Table 1.4, All Returns: Adjusted Gross Income, Exemptions, Deductions, and Tax Items is a treasure trove of telling statistics. Information junkies will be in hog-heaven as soon as they open the spreadsheet, because these numbers cut through the fog of employment and income.
As many of you know from previous entries on jobs, work, etc., I am self-employed and have no employees. I am one of the 1% who earns more than $50,000 annually via self-employment who is not a licensed professional or equivalent. Since I have to file Schedule C tax returns, I am keenly aware of the deductions that are only available to sole proprietors/self-employed taxpayers.
Only self-employed taxpayers get to deduct half of their healthcare insurance premiums. You have to earn a fair sum to actually afford the sky-high costs of health insurance. We pay $15,300 per year for stripped-down healthcare coverage, which is more than the annual earnings of the bottom 35 million workers in the nation.
Only 3.9 million taxpayers took the self-employed health insurance deduction.That's a pretty good indicator of how many taxpayers are actually living solely on their income, that is, they don't have a spouse who has family healthcare coverage via being an employee for the government or a corporation.
The number of taxpayers who took the deductible part of self-employment tax was 18.6 million. This includes everyone with a net income from a business. According to the IRS tax data, 7.39 million taxpayers reported self-employment of $50,000 or more.
This is almost 3 million more people than counted in the infographic, which shows that it takes cross-checking various agency statistics to sort through all the data.
This means roughly 5% of the workforce is self-employed and earns $50,000 or more annually.
According to the Federal Reserve of St. Louis (FRED) data shown in The Decline of Self-Employment and Small Business (April 22, 2013), there are 5.5 million incorporated self-employed and 9.2 million unincorporated self-employed.
If we assume most of the incorporated self-employed are professionals, this leaves roughly 1.9 million non-professional self-employed who earn more than $50,000 annually (7.39 million - 5.5 million).
However you figure it, there are less than 2 million non-professionals making a middle class living via self-employment. That is roughly 1.5% of the 121 million full-time workers in the nation.
I confess to being astonished at the tiny number of truly independent self-employed people in the U.S. Only 3.9 million of us deduct our healthcare insurance, and only 7 million out of 145 million earn $50,000 or more--and on the left and right coasts, $50,000 is not a middle-class income--it is borderline poverty.
If we only counted the self-employed who earn enough to afford a minimally middle class lifestyle in high-cost urban zones such as greater New York City, Boston, Los Angeles, the San Francisco Bay Area, etc., the number declines to an even thinner slice of the workforce--no more than 4 or 5 million, depending on where you draw the line.
It isn't easy to earn enough to afford a middle class life via self-employment.Including the professional class, perhaps 3% of the workforce is truly independent.
Disclosure: None


