
Emerging Markets Equities Topped Asset Class Returns Last Week
Stock markets in emerging markets continued to rebound last week, posting the strongest gain for the major asset classes, based on a set of exchange-traded funds. No mean feat, considering that nearly every slice of global markets rallied during the trading week through Friday, Sep. 6.
Vanguard FTSE Emerging Markets (VWO) jumped 2.2% last week. The rally marks the fund’s second weekly gain. The latest pop follows a recent forecast from GMO, a Boston-based asset manager, that shows that shares in emerging markets will generate the strongest real returns in the years ahead compared with other asset classes.
“The price you’re being asked to pay for those [markets] is not particularly stretched in a world where everything else is,” advises Tommy Garvey, a member of GMO’s asset allocation team.
Last week’s weakest performer among the major asset classes: inflation-indexed Treasuries. The iShares TIPS Bond (TIP) fell 0.2%–the first weekly decline for the ETF since mid-July.
Last week’s broad-based rally lifted an ETF-based version of the Global Market Index (GMI.F). This unmanaged benchmark, which holds all the major asset classes (except cash) in market-value weights, rose 1.3% — the index’s second straight weekly advance.

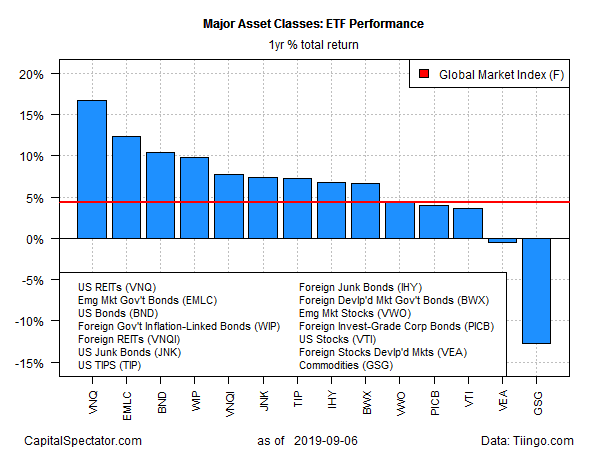
For the one-year results, US real estate investment trusts (REITs) continue to lead among the major asset classes. Vanguard Real Estate (VNQ) is currently higher by 16.7% on a total return basis.
Meantime, broadly defined commodities continue to suffer the weakest performance. The iShares S&P GSCI Commodity-Indexed Trust (GSG) is down 12.7% over the past 12 months through Friday’s close.
GMI.F is posting a moderate 4.3% total return for the trailing one-year window.
Despite the latest rally, profiling the major asset classes via momentum indicators still presents a mixed picture. The analysis is based on two sets of moving averages for the ETFs listed above. The first compares the 10-day moving average with its 100-day counterpart — a proxy for short-term trending behavior (red line in chart below). A second set of moving averages (50 and 200 days) represent an intermediate measure of the trend (blue line). At last week’s close, short-term momentum reflected a relatively mixed profile compared with recent history. Perhaps the week ahead will provide clarity on whether the latest rally is noise or a prelude to an early sign that markets are poised for an extended revival in upside momentum.

Disclosure: None.


