
Elliott Waves From December Low Suggests XLK To Make New Highs
XLK Pattern Suggests New Highs on the Horizon
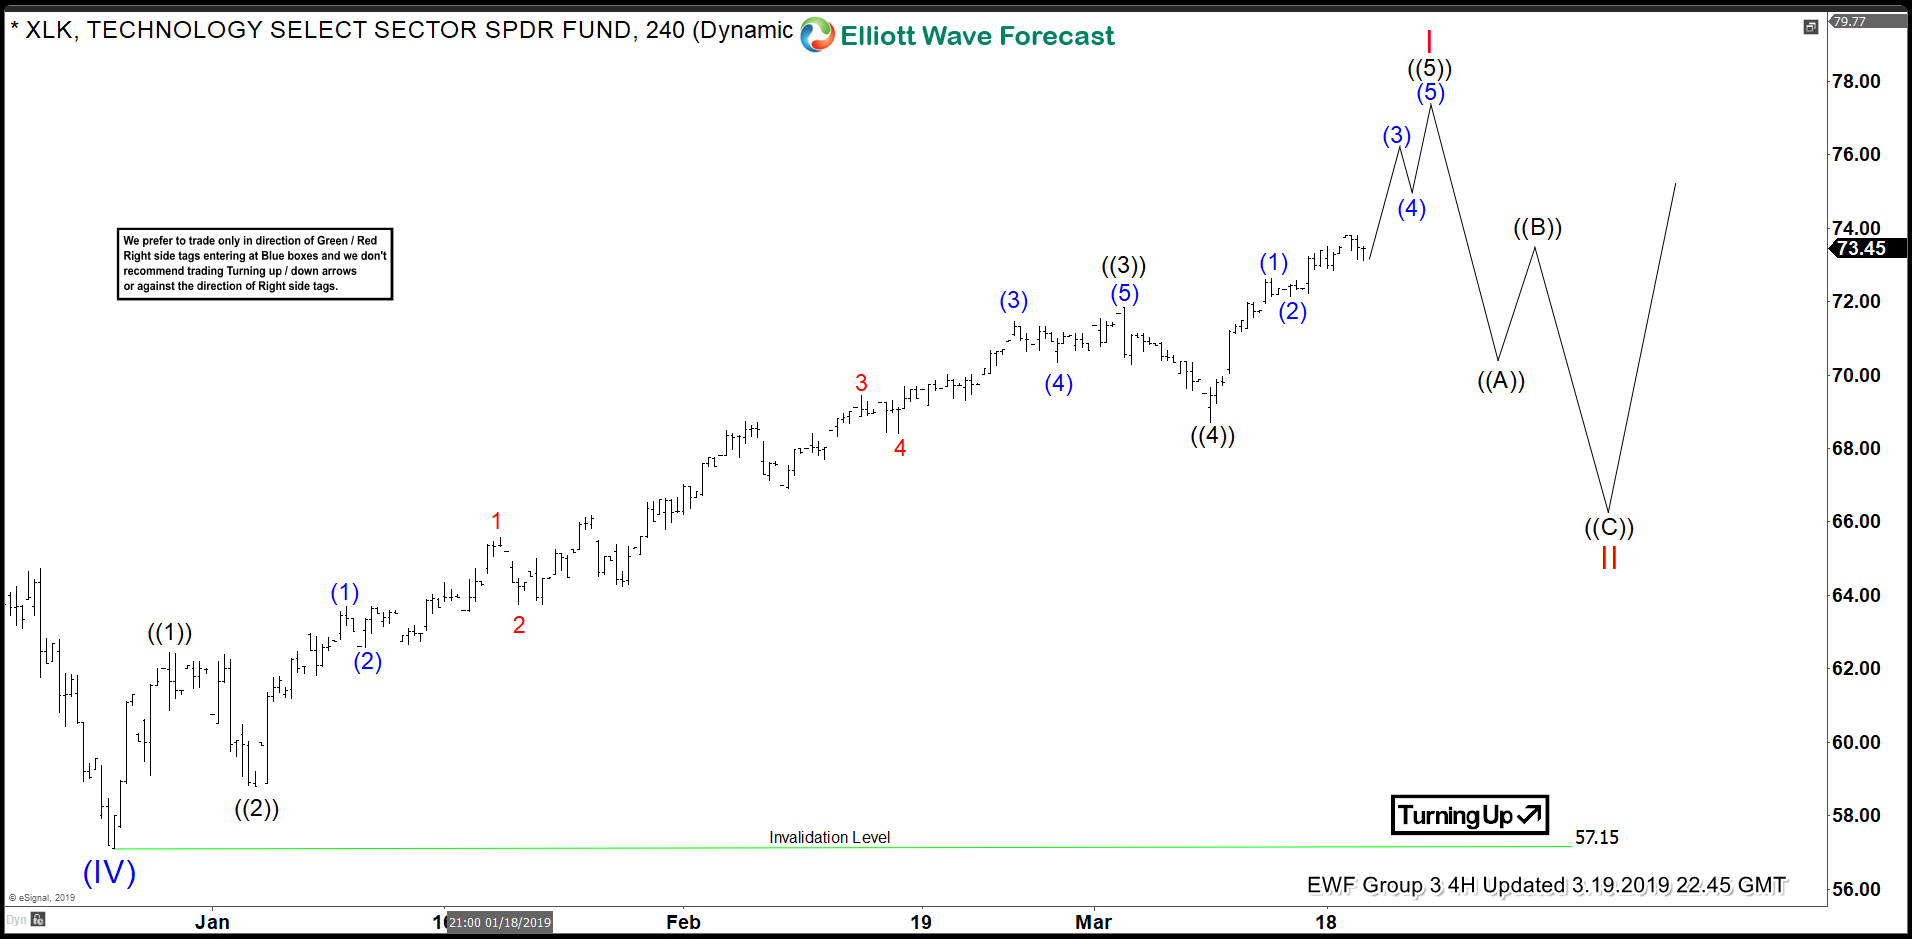
After a 24.5%, 7-wave, decline from the $76.27 peak of 10/3/2018, XLK appears to be showing signs of a bottom. This technology ETF, XLK, is now showing a clear 5 wave impulse from the 12/24/2018 lows which we are labeling as Super Cycle degree wave (IV). The clearest evidence we see is blatant separation evident in its labeled wave ((3)). Also of note is the ETF breaking above all prior highs printed on its decline. These include the 10/16/2018 high at $72, the 11/8/2018 high at $71.16, and the 12/3/2018 pivot high at $69.71.
As of this publication, the ETF is printing $73.45. We are well within the throws of its fifth wave off the December low. Consequently, as Elliott wave practitioners, we know this fifth wave completes the larger fractal wave I. Afterwards a 3 wave retracement against the December lows will take place. It is after this 3 wave projected event that the largest and most powerful sequence will emerge as wave III.
It is this next extension projection that will take XLK to new highs above $76.27. Once we have the wave II bottom in place we will be able to measure the next target for wave III. Moreover, this target often relates to a Fibonacci extension of 1.618 times the length of wave I from the bottom of wave II. Hence, we need more data.
(Click on image to enlarge)
Have no idea about or new to the Elliott wave? Does the chart above look like a foreign language? Every day in our Group 3 Services we measure, map, and monitor XLK and 25 other instruments. Just ...
more

