
Dynamics Between Buybacks, Margin Debt, Foreigners’ Purchases Of US Stocks And Extended Multiples
Buybacks made a comeback in 1Q21. Nonetheless, they are no longer as strong a tailwind for equities as they were in 2018 and 2019. Margin debt and foreigners continue to support stocks, and will pose problems once they turn.
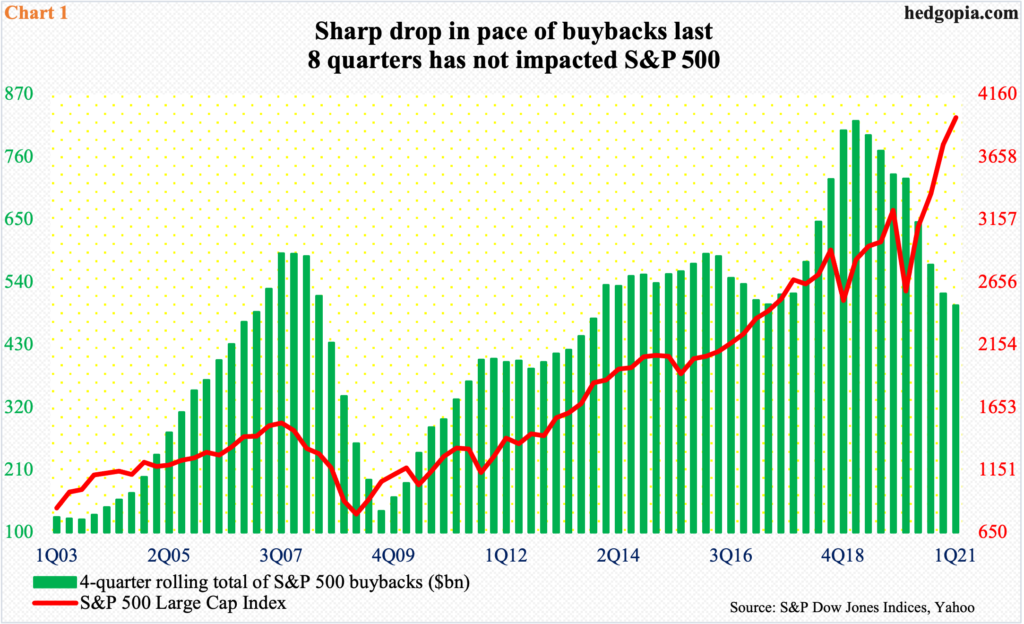
S&P 500 companies spent $178.1 billion in buybacks in the first quarter, up from $130.5 billion quarter-over-quarter but down from $198.7 billion year-over-year (SPX, SPY).
In 2Q20, post-pandemic, buybacks reached an eight-year low $88.7 billion. From there, spending has snapped back nicely but remain way off the all-time high of $223 billion posted in 4Q18.
On a four-quarter basis, buybacks reached a record $823.2 billion in 1Q19 (Chart 1). On that basis, 1Q21 was $499.1 billion and can continue higher in the remaining quarters of the year, as the Fed likely will continue to allow the leading banks and brokers to spend, subject to certain rules.
In 1Q21, of the top 20 spenders, JP Morgan (JPM) spent $4.8 billion, Goldman Sachs (GS) $3.6 billion, Bank of America (BAC) $3.5 billion and Morgan Stanley (MS) $2.6 billion. The leading spenders were of course tech, with Apple (AAPL) leading with $18.8 billion, Google owner Alphabet (GOOGL) $11.4 billion and Microsoft (MSFT) $6.9 billion.
In 2018 and 2019, the buyback tailwind was very strong – $806.4 billion and $728.7 billion respectively. Compared to those two years, at $519.7 billion, 2020 fared poorly – relatively, of course. In all probability, this year will be better than last year.
Equity bulls will need this, as two other major sources of tailwind are so extended that they can go the other way any time.
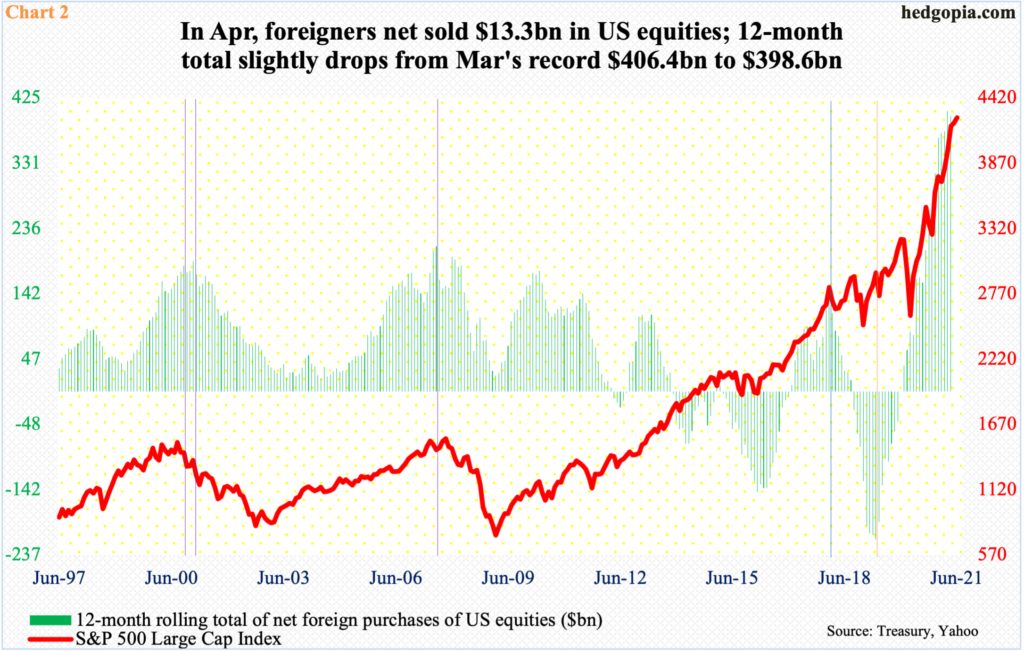
As a matter of fact, foreigners already pulled back their horns in April, reducing their exposure to US stocks by $13.3 billion. This was the first monthly net selling in a year. As a result, the 12-month total declined to $398.6 billion in April from March’s record high $406.4 billion.
It is too soon to declare this marks a peak in foreigners’ purchases. What we do know is that they are sitting on tons of gains, having flipped positive in December 2019. The green bars in Chart 2 have since gone vertical; the S&P has done so since March last year. The two maintain a tight relationship and, if past is prelude, net selling by foreigners is bound to adversely impact the index.
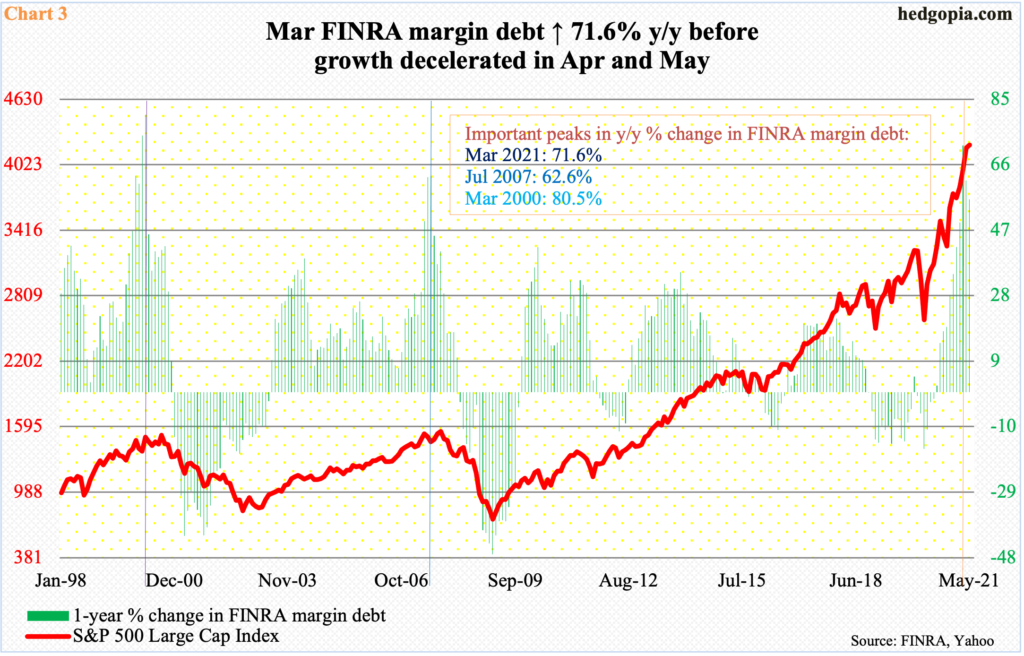
The other tailwind – quite a tailwind at that – has been margin debt. In May, it increased $14.4 billion month-over-month to $861.6 billion. This was the 14th consecutive monthly gain. In March last year, the metric hit a low of $479.3 billion. From there, margin debt has gone up 79.8 percent; from an intraday low of 2191.86 reached in that month, the S&P 500 is up just under 94 percent. Going back to 1997, the two sport an r of 0.94 (chart here).
It will not be an exaggeration to say that as goes margin debt so goes the S&P 500. The willingness to take on leverage is still there. Amidst this, March marked an important milestone. From a year ago, margin debt surged 71.6 percent in that month, with deceleration in growth in April and May. In the past, major peaks in margin debt were marked by similar year-over-year growth – 80.5 percent in March 2020 and 62.6 percent July 2007 (Chart 3).
This is worth watching. Sooner or later, gravity will get to work. Once that happens, margin debt will begin to act as a headwind for stocks.
With corporate buybacks no longer a strong tailwind, a reversal – if it is that – in investor willingness to take on margin debt and foreigners’ aggressive purchases of US stocks will have come at an interesting juncture. Both these groups are sitting on loads of paper profit, with stretched valuations, unwinding of which can act as a self-fulfilling prophecy.
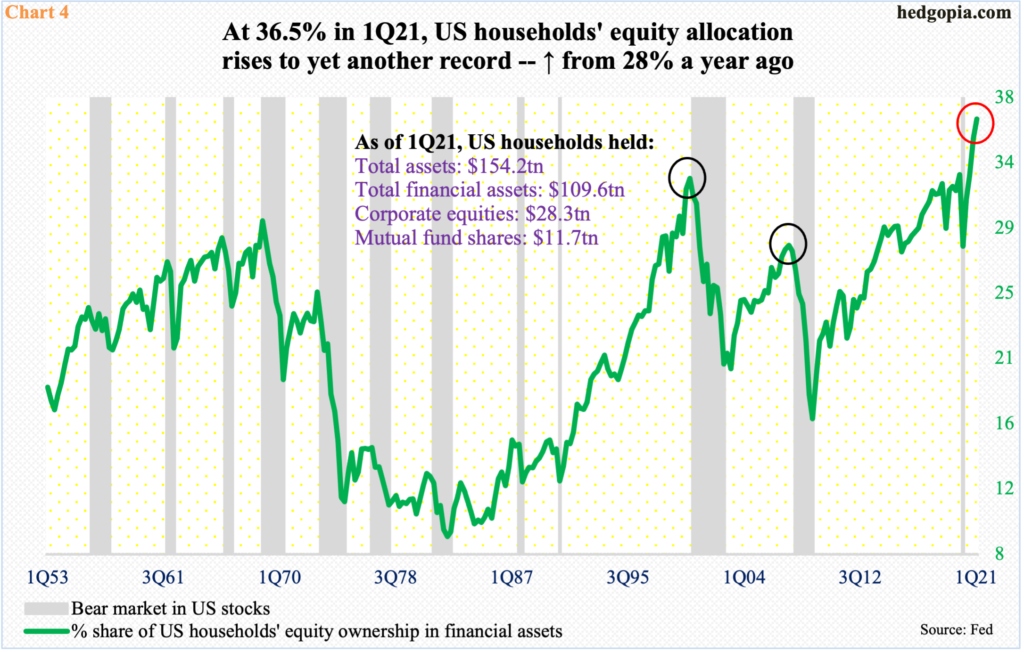
Take US households’ equity allocation. In 1Q21, it rose to 36.5 percent – a fresh record (Chart 4). In 4Q19, the metric peaked at 32.8 percent, then tumbling to 28 percent in the next quarter. The 1Q20 bear market was short, giving way to a massive rally in stocks. Households’ equity allocation has followed – rising way past the prior highs from 1Q00 (32.5 percent) and 2Q07 (28.1 percent).
As high as the current reading is, nothing says it cannot continue higher. At the same time, the more stretched the metric is the higher the reversal risks. Hence the importance of Charts 2 and 3. If they start unwinding, Chart 4 in all probability follows.
Thanks for reading!
Disclaimer: This article is not intended to be, nor shall it be construed as investment advice. Neither the information nor any opinion expressed here constitutes an offer to buy or sell any ...
more

