
DXY Index Stays Lower After Currency Markets Flash Crash
After a dreadful end to 2018 – December was the worst performing month for US stocks since the Global Financial Crisis – 2019 has started on a similarly sour note. Although the US-China trade war is supposedly in a period of détente, with a 90-day ceasefire on new tariff impositions currently in place, the collateral damage of the US-China trade war may actually be behind the currency markets flash crash itself.
SEVERAL FACTORS CREATED CONDITIONS FOR THE FLASH CRASH
Thin liquidity conditions, thanks to a holiday in Japan, coupled with Apple’s corporate earnings guidance released after market hours in the US, which highlighted the deepening impact of the US-China trade war, sparked a sharp move higher in the Japanese Yen during the period between North American trading on Wednesday and Asian trading on Thursday.
The latest currency markets flash crash saw pairs like USD/JPY fall all the way to its 2018 low while others like AUD/JPY dropped to its lowest level since May 2009. However, at the time of writing, markets had stabilized, with the Yen only up by +1% or so on the day. Meanwhile, Apple’s stock has been punished this morning, down by -9% at the time of writing.
USD/JPY PRICE CHART: DAILY TIMEFRAME (JANUARY 2018 TO JANUARY 2019) (CHART 1)
(Click on image to enlarge)
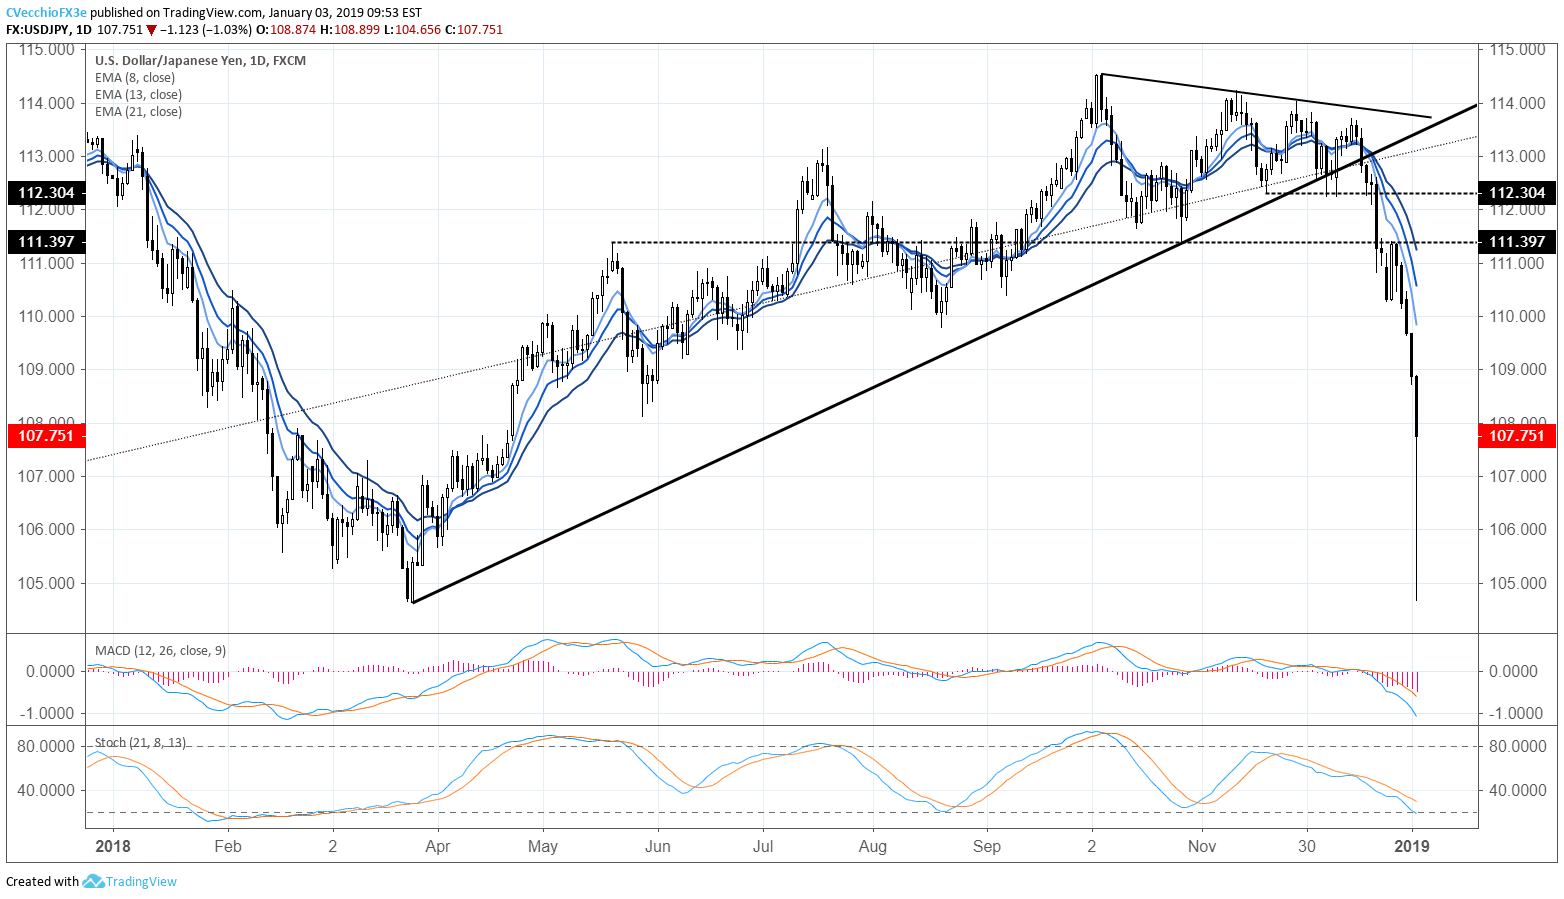
Despite the recovery from the lows overnight – down at 104.66, just above the 2018 lows – USD/JPY’s technical structure remains in terrible shape. Price continues to extend itself further below the daily 8-EMA, a sign of accelerating losses; the bearish EMA envelope remains fully in place. Both daily MACD and Slow Stochastics continue to trend lower, deeper into bearish territory as well.
In other words, the approach should be to sell USD/JPY rallies when possible; otherwise, you’re just trying to catch a falling knife. More technical evidence is required before a bottom can be sought (similarly, while we were bearish USD/JPY below 112.23 in our last Japanese Yen weekly technical forecast of 2018, USD/JPY at 105.00 is a different story from a valuation perspective).
DXY INDEX PRICE CHART: DAILY TIMEFRAME (JANUARY 2018 TO JANUARY 2019) (CHART 2)
(Click on image to enlarge)
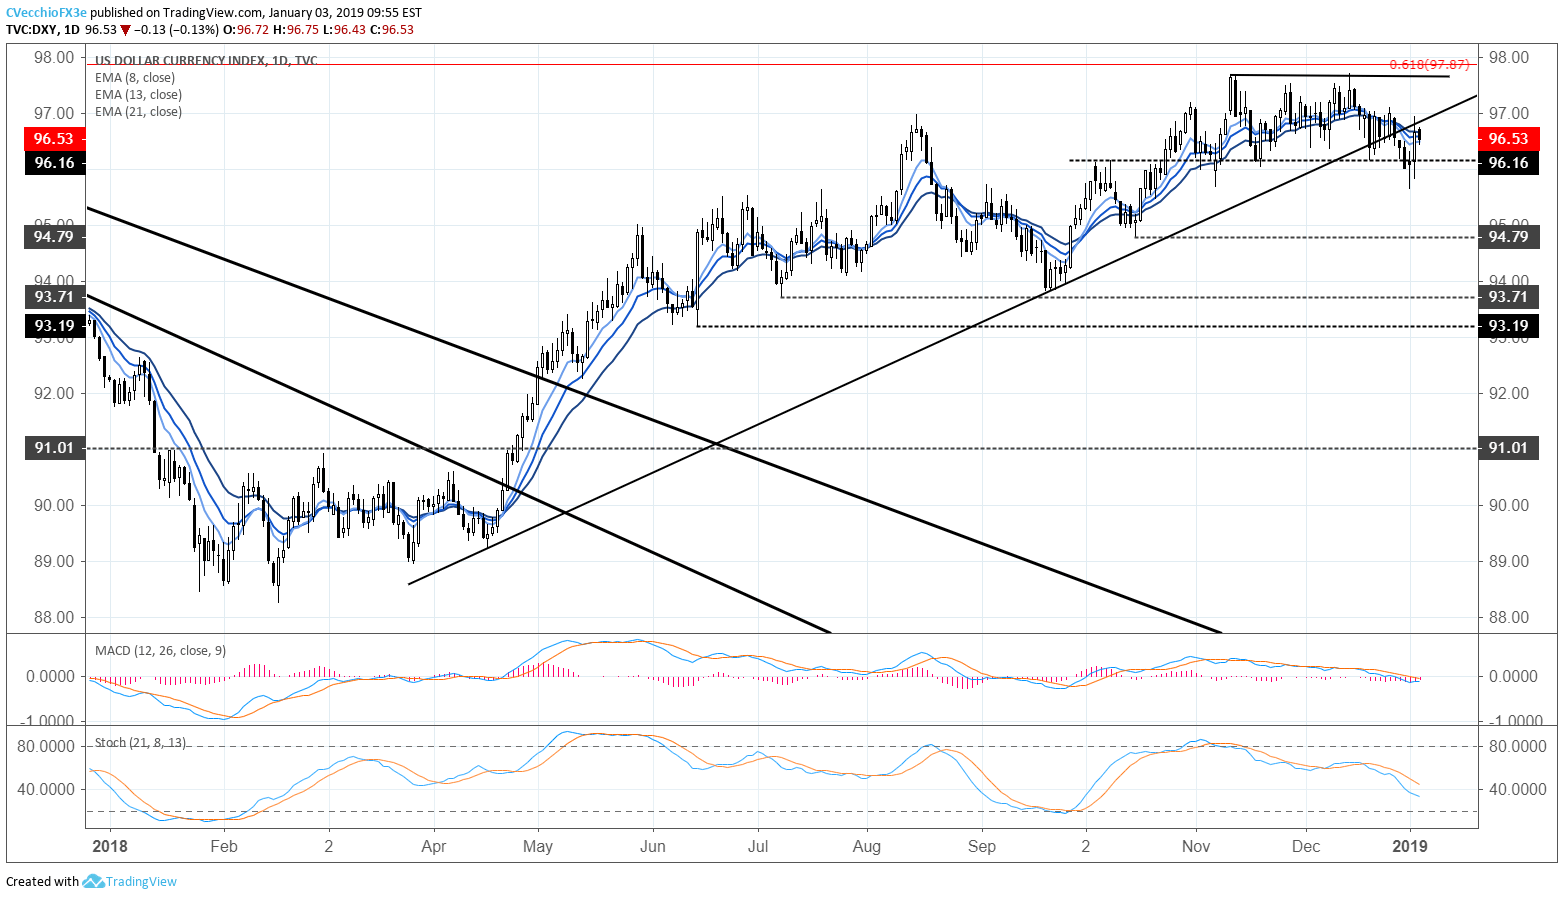
Overall, despite the violent gyrations in the JPY-complex, the DXY Index has traded in a narrow trading range on Thursday. Overall, including taking into account yesterday’s performance, the outlook for the US Dollar (via the DXY Index) remains neutral at best.
While there hasn’t been much follow-through to the downside so far, the fact remains that the DXY Index is trading below its uptrend from the April and September 2018 lows. Even as price has risen back above its daily 8-EMA, the daily 13- and 21-EMAs have not been breached. Accordingly, both daily MACD and Slow Stochastics continue to point lower as they break into bearish territory. A breach of the weekly low of 95.65 is needed to validate a bearish bias, which remains the higher likelihood outcome.
Disclosure: Do you want to see how retail traders are currently trading the US Dollar? Check out our IG Client Sentiment ...
more

