
DXY Dollar Index Price Falls To 92.50 On Poor ADP Figures, NFP Ahead
The DXY Dollar Index price has ended its temporary rebound and now it seems determined to come back down. It’s located at 92.57 level versus 92.78 today’s high.

Image Source: Pexels
The index has started falling again after reaching a dynamic resistance. Now, it could move down again after taking a hit from the ADP Non-Farm Employment Change.
The economic indicator reported only 374K jobs in August versus 640K expected. It has bounced from 326K reported in July, but this could be bad for the US Dollar. The US will release the ISM Manufacturing PMI later today, which is expected to drop from 59.5 to 58.5, signaling a slowdown in expansion. In addition, the Final Manufacturing PMI could remain steady at 61.2 points, the Construction Spending could rise by 0.2%, the ISM Manufacturing Prices may fall from 85.7 to 84.1. At the same time, the Wards Total Vehicle Sales indicator could slip to 14.4M from 14.8M.
So, the fundamentals will move the markets today. All these economic figures have a big impact on the DXY. Poor economic figures could force the index to resume its drop. This situation indicates USD’s depreciation.
DXY Dollar Index price technical analysis: Sell-off to support zones
(Click on image to enlarge)
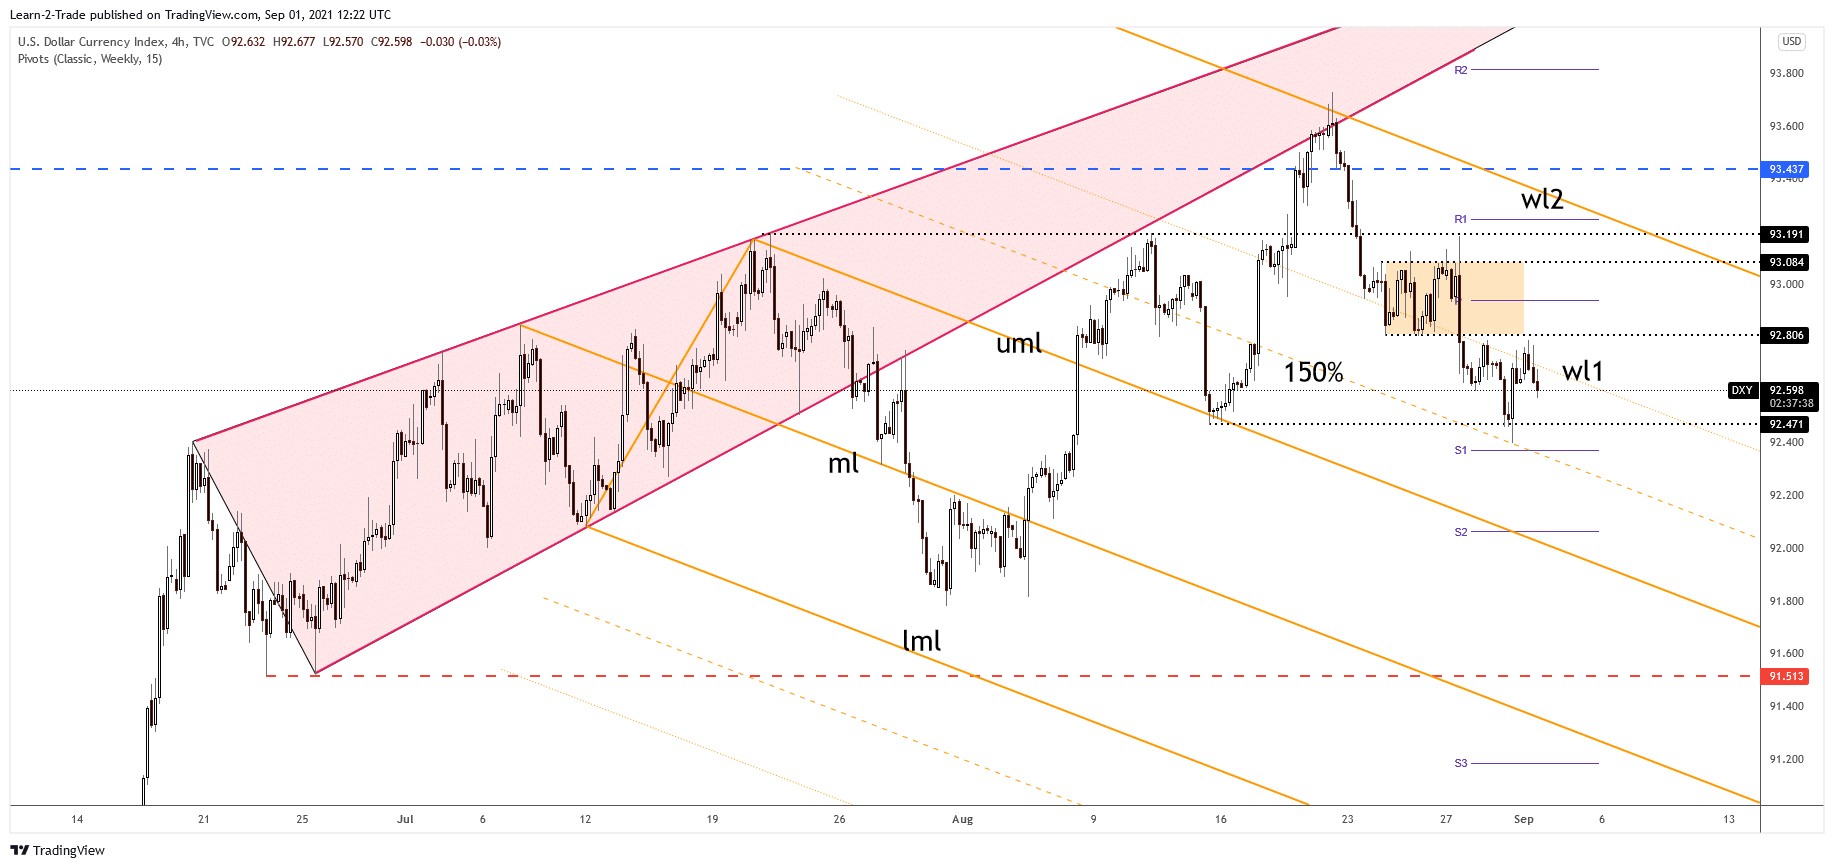
DXY Dollar Index 4-hour price analysis
The DXY Dollar Index price has gained a little in the short term after registering only a false breakdown through 92.47 static support, a former low. It has found temporary support on the 150% Fibonacci line. Unfortunately, it failed to reach the 92.80 static resistance level or stabilize above the first warning line (wl1) of the descending pitchfork signaling massive pressure.
The outlook is bearish in the short term after making a valid breakdown below 92.80 level, after escaping from the minor range. 92.47 is seen as static support. Breaking below this level could signal a further drop. Also, the 150% Fibonacci line and the weekly S1 (92.37) are representing downside obstacles. So, only a valid breakdown through these levels could really validate a larger downside movement ahead of the US Non-Farm Payrolls.
Disclaimer: Foreign exchange (Forex) trading carries a high level of risk and may not be suitable for all investors. The risk grows as the leverage is higher. Investment objectives, risk ...
more

