
Driving Outperformance With A State-Ownership Screen
The value factor has outperformed growth globally, including in emerging markets (EM), since the last half of 2020.
Valuations for growth companies in EM look “stretched” by traditional metrics —while many notable value investors believe EM value stocks represent one of the bright spots for forward-looking returns.
EM value multiples have remained stagnant and near single-digit numbers over the last six years—tough to find in the U.S.—while growth multiples have been rising.
Meanwhile, it encourages us to see how the WisdomTree Emerging Markets ex-State-Owned Enterprises Index (EMXSOE), which has elements of a growth-tilted core strategy, has managed to generate excess returns over this most recent period, we believe solidifying its state-owned enterprise (SOE) screen as a driver of outperformance.
Valuations in EM
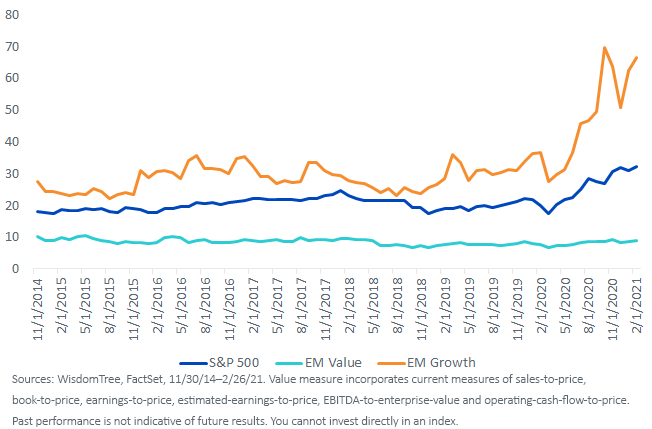
The rapid recovery in prices and sluggish earnings and sales we’ve experienced over the last 12 months have caused standard valuation metrics to spike in certain markets. EM is one.
As we can see in the chart below, trailing price-to-earnings (P/E) for companies in the most expensive valuation quartile (“EM Growth”) spiked in the middle of last year, deviating from its historical spread versus the lowest multiple stocks (“EM Value”) and the broad MSCI EM Index. (These sorts are all done within industries, so they don’t represent sector bias of higher multiple sectors).
It is interesting to see how the S&P 500 Index’s P/E ratio has followed a similar path as the EM growth stocks, and the EM value basket is trading around the same 10 times earnings it has traded at over the last six years.
Premium Multiples for Premium Growth Rates
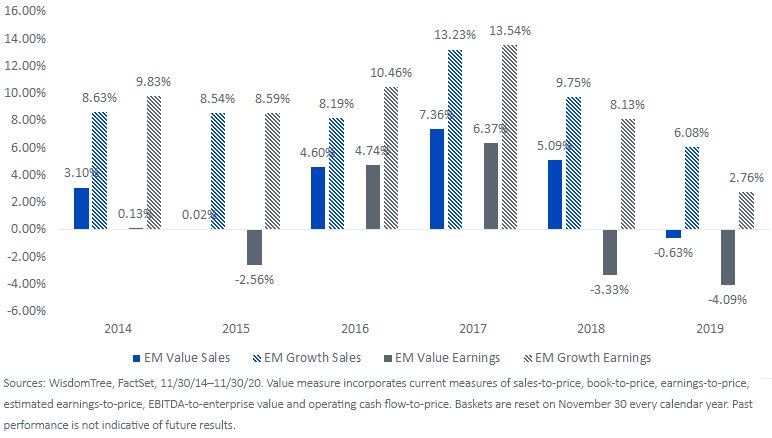
When profit and sales growth is scarce, investors may assign greater value—and higher multiples—to those companies that are consistently growing. Combining valuation with sales and earnings growth metrics can give investors greater insight into why they see significant valuation spreads in certain areas of the market.
The chart below compares the forward one-year growth rates of constituents in these EM baskets. Companies in the EM Growth portfolio at the end of 2019 saw a median sales growth of 6.08% during 2020, while companies in the EM Value portfolio saw their median sales decrease by 0.63%.
During the last six calendar years, the EM Growth basket has shown stronger sales and earnings growth, leading to higher multiples. The average differential in sales growth between these baskets was 5.81%, favoring the EM Growth basket. The strong sales growth together with higher margins and profitability caused the differential in earnings growth to be 8.67%.
1yr. Median Growth
EMXSOE vs. MSCI EM
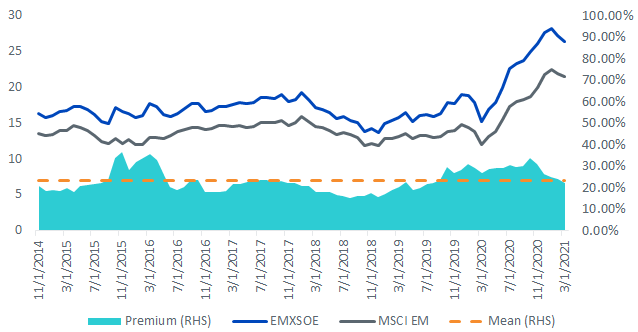
The WisdomTree EM ex-State-Owned Enterprises Index (EMXSOE) was created with the objective of improving investors’ exposure to the EM region. Through its SOE screen, EMXSOE removes companies with significant government ownership from its investment universe, resulting in a portfolio with constrained over-weights in sectors with a growth tilt.
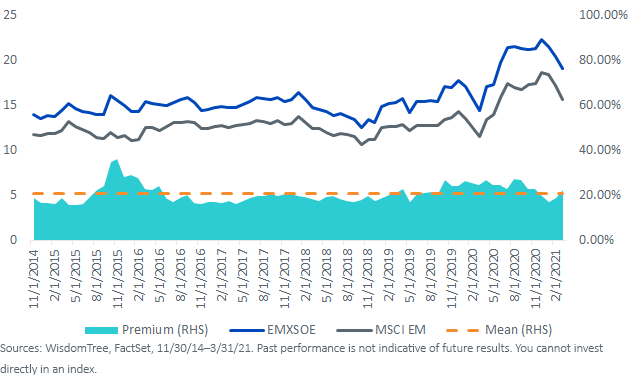
Looking at the trailing P/E ratio, we can see that EMXSOE’s basket is not more expensive than usual compared to MSCI EM. It even looks slightly cheaper than its history when adjusting for forward earnings.
Trailing P/E Ratio
Forward P/E Ratio
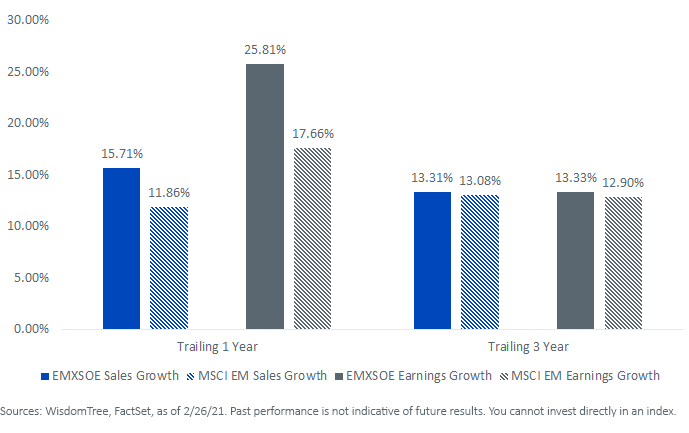
Similarly, EMXSOE’s sales and earnings growth rates have exceeded MSCI EM’s in the past 12- and 36- month periods.
Fundamental Growth Rates
Performance Drivers
Since its inception in 2014, EMXSOE has outperformed the MSCI EM by more than 3.5% annually. EMXSOE’s constrained tilts toward sectors with a higher growth profile have contributed to the outperformance, but the main driver has been the SOE screen along with the resulting over-/under-weights in high-/low-profitability companies in EM.
A testament to the SOE screen as a consistent driver of outperformance is the fact that EMXSOE has outperformed the MSCI EM in periods when growth has outperformed value—like 2017—and to a lesser extent, during the most recent value-led market cycle.
Growth of $100
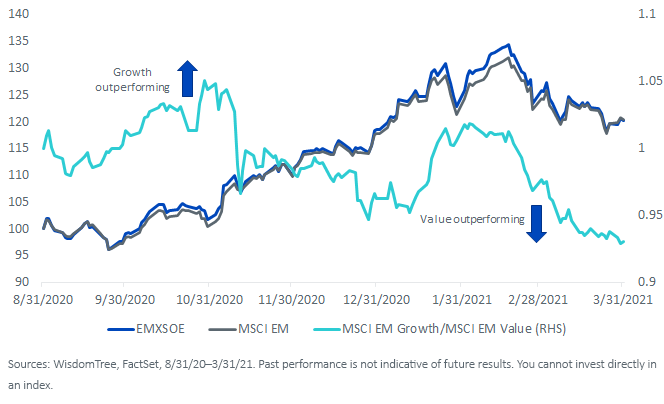
Whether we’re seeing the start of a bull market of value or perhaps just a six-month outperformance, EMXSOE’s performance in growth and value markets reveals that it’s a strategy reliant on stock selection more than factor tilting.
Disclaimer: Investors should carefully consider the investment objectives, risks, charges and expenses of the Funds before investing. U.S. investors only: To obtain a prospectus containing this ...
more

