
Dow, Nasdaq Rally As USD Pulls Back To Start A Busy Week
US STOCKS GAP-HIGHER TO START A BIG WEEK
We’re now in the final days of September and Q3 and a number of themes remain of interest. US stocks have spent much of the past six months rallying – until the September open, that is. So far, this month has brought a crude change of pace to US equity markets as both the Dow and the Nasdaq went from setting fresh all-time-highs at the beginning of the month to weeks-long pullbacks that remain in full view ahead of the Q4 open. In the US Dollar – the currency was beset by a bearish trend that had punctuated the backdrop since March, but that too found a bit of relief as a big area of support came into play in the opening days of the month, and buyers responded by driving the USD higher over the past few weeks.
This week’s economic calendar is loaded so there is not a lack of possible drivers. On top of this week’s data outlays, which includes NFP on Friday along with PMIs, is the start of US Presidential Debates with the first kicking off tomorrow at 9 PM ET. This will likely have a big pull on markets given the outsized government support that’s been in play since the coronavirus came into the picture earlier this year.
Stocks have so far opened this week with a bang, gapping-up, and continuing to trend-higher just after the US equity open. As looked at last Thursday, some key support areas had already come into the picture and in the Nasdaq – price action has catapulted off of that support and beyond an area of potential resistance. That move from Thursday’s support has already erased 38.2% of the September sell-off. This amounts to a fresh weekly high for the Nasdaq and there’s another area of potential resistance sitting just overhead, taken from around the 11566 level up to the approximate 11626.
NASDAQ 100 FOUR-HOUR PRICE CHART
(Click on image to enlarge)
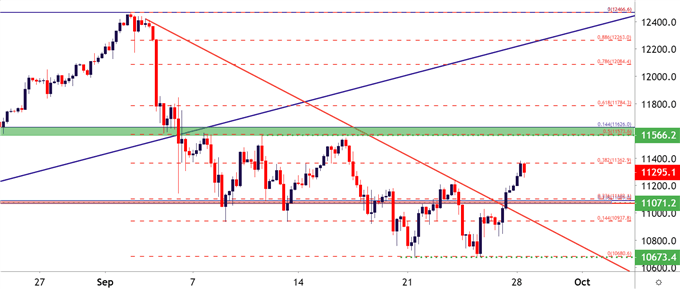
Chart prepared by James Stanley; Nasdaq 100 on Tradingview
DOW BOUNCE FINDS BIG ZONE OF LONG-TERM SUPPORT/RESISTANCE
The Dow Jones Industrial Average has similarly bounced up to a 38.2% retracement of the September sell-off. The difference here, however, is one of longer-term consideration, as the bounce in the Dow has pushed into a big zone of long-term support-turned-resistance. There’s also a bearish trendline projection in here, which can be found by connecting early and mid-September swing-highs, adding a bit of confluent to the matter.
For those that are looking for bearish US equity plays, the Dow may be a bit more attractive given the context of resistance around current levels.
DOW JONES DAILY PRICE CHART
(Click on image to enlarge)
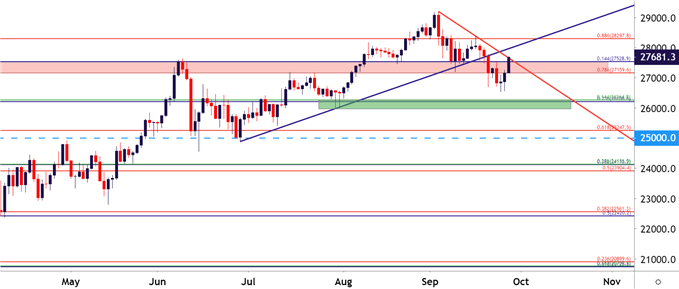
Chart prepared by James Stanley; Dow Jones on Tradingview
US DOLLAR PULLS BACK TO KEY LEVEL – WILL BUYERS DRIVE THE TREND?
Last week was a big one for the US Dollar.
The currency had spent much of the prior six months in varying forms of sell-off. A big zone of long-term support finally showed up in early-September and through the first few weeks of the month, this area merely helped to stall the sell-offs.
But – a batch of short-term support popped up that held the lows for almost a couple of weeks, and last Monday saw bulls spring to action by driving the USD up to fresh two-month-highs. DXY made a fast run at the 95.00 handle, falling just a bit short of that level ahead of last week’s close, and this week has started with a pullback.
At this point, the 94.23 level is helping to hold the lows. This is the 38.2% retracement of the 2017-2018 major move in DXY, and this is the same study from which the 23.6% retracement came into play in the early-portion of this month in that confluent batch on the chart.
US DOLLAR EIGHT-HOUR PRICE CHART
(Click on image to enlarge)
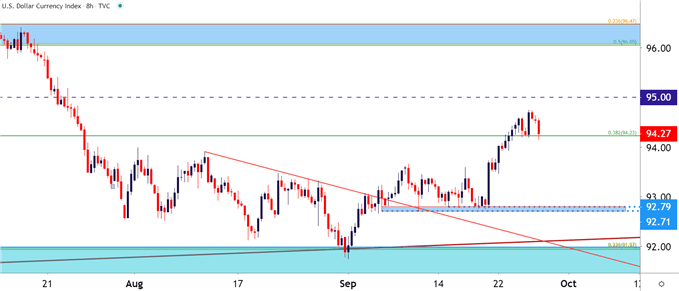
Chart prepared by James Stanley; USD, DXY on Tradingview
US DOLLAR STRATEGY MOVING FORWARD: WATCH THE DATA INTO Q3 CLOSE
This could be a pensive week for themes around the USD. Not only are we in the final week of September and Q3 – but this week’s economic docket is loaded and there’s an intense focus on the US with high-impact data due out each day of this week Tuesday-Friday. On top of that, Presidential debates begin tomorrow night and this could have some fiscal implications, going along with the PCE and PMI prints on Thursday out of the US, followed by the big one of NFP on Friday of this week.
The tone in USD is likely going to be pushed forward by the culmination of these drivers. Ahead of the outlay, there’s been a recent penchant for USD-strength and unless this week’s US data prints abysmally bad, opening the door for more stimulus, that potential for USD-strength may remain.
US DOLLAR DAILY PRICE CHART
(Click on image to enlarge)
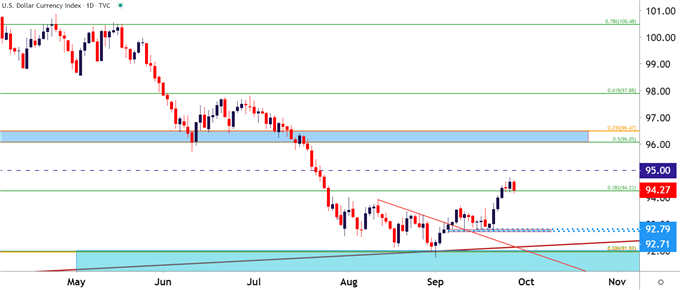
Chart prepared by James Stanley; USD, DXY on Tradingview
Disclosure: See the full disclosure for DailyFX here.


