
Dow Jones & DAX 30 Outlook: German Stocks To Close The Gap?
Risk appetite roared in the early hours of Friday’s trading session as China confirmed it reached a phase one trade deal with the United States. Still devoid of detail, however, optimism was reeled in as investors took stock of what was actually delivered. Now, market participants may require concrete figures and enforceable terms before embarking on the next leg higher.
Consequently, the DAX 30 could look to outperform the Dow Jones after UK Prime Minister Boris Johnson secured an outright conservative majority and Christine Lagarde, now head of the ECB, hinted at fiscal policy as a route of stimulating the European economy.
DOW JONES PRICE CHART: DAILY TIME FRAME (JANUARY 2019 - DECEMBER 2019) (CHART 1)
(Click on image to enlarge)
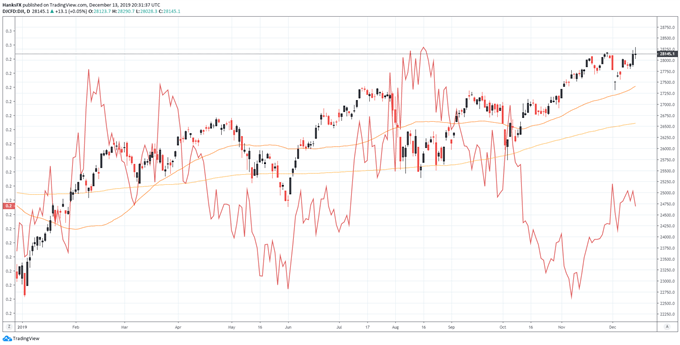
Dow Jones to DAX 30 ratio overlaid in red. Chart created with TradingView.
Given the fundamental forces facing Germany and the United States, the former has been granted a relatively greater degree of certainty. While a trade breakdown would undoubtedly undercut the DAX 30 alongside the Dow Jones, the nature of the two assets could allow for an intriguing trading opportunity, looking for bearish Dow positions while favoring long exposure to the DAX 30 and capturing the differential between the two.
Therefore, the position would be hedged against broader uptick in risk aversion, while possessing the opportunity to capitalize on an equity extension higher – relying on the DAX 30 to outpace the Dow Jones given the fundamental forces at play.
US DOLLAR BASKET (DXY) PRICE CHART: DAILY TIME FRAME (JANUARY 2019 – DECEMBER 2019) (CHART 2)
(Click on image to enlarge)
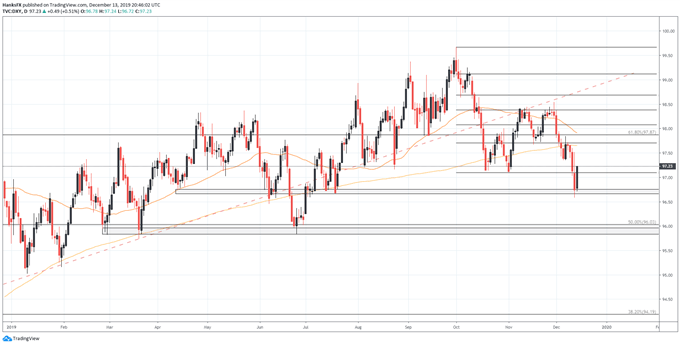
Chart created with TradingView.
Another investment vehicle that may offer access to the same themes is EUR/USD. As it stands, the Euro has much to gain from changes in fiscal policy and relative Brexit clarity. The US Dollar has suffered a string of declines in December thus far via the Dollar Basket Index (DXY), falling comfortably beneath its 200-day moving average. Thus, EUR/USD may continue to exhibit strength as the Dollar wrestles with a dovish Federal Reserve and trade war headlines.
EUR/USD PRICE CHART: DAILY TIME FRAME (JANUARY 2019 – DECEMBER 2019) (CHART 3)
(Click on image to enlarge)
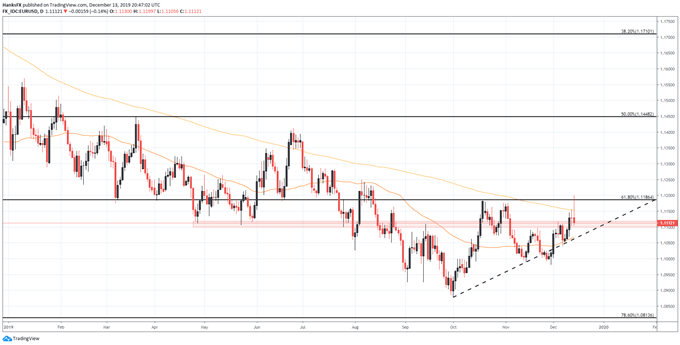
Chart created with TradingView.
With that in mind, EUR/USD could take aim at resistance posed by the 61.8% Fibonacci level around 1.1864. Subsequent areas of interest could reside around 1.1250 which has been an area of contention for the pair throughout 2019.


