
Don’t Let Short Sightedness Hurt Your Portfolio
- Investors focus on short term market performance despite saying they are long term investors
- While downturns seem terrible, in the long term, it is just a blip
- Avoid the emotional decision to make changes in correcting markets, focus instead on your financial goals
December of 2018 brought extreme market volatility to any portfolio holding equities. This volatility brings many interesting conversations. Many start with, “if I had known this was happening, I would have sold and bought back later” or “I read this was coming. I should have sold everything.” Others did sell and are waiting until they “feel better” to get back into the market. The stock market in the short term can be volatile and while investors often say they are invested for the long term, they become overly sensitive to short term volatility and make poor investment decisions.
In a study titled “Risk Aversion or Myopia? Choices in Repeated Gambles and Retirement Investments,” Shlomo Benartzi and Richard Thaler, professors at the Anderson School at UCLA and the University of Chicago, studied a group of investors. Investors were shown a distribution of one-year stock market returns. Then when asked how much they would allocate of their portfolio to stocks, they choose 40%, with 60% to bonds. When shown 30 year stock returns, they allocated 90% to stock and 10% to bonds. We all have seen the long-term performance of the stock market. Amongst all the noise, there is a smooth, long term growth rate that we all want, but seem to forget about in the middle of all the noise.
With financial news running 24-7 and access to investments on a smart phone, investors are tempted to monitor their investments on a frequent basis. This makes it difficult to keep a long term focus on portfolio performance. The reality is that these short-term market fluctuations are not a large as they seem. Just as the study showed, when truly focused long term, an investor’s perspective will change.
The market moves in cycles with periods of contractions followed by periods of expansions. MorningStar data shows there have been eight market downturns in the past 43 years. The regions shaded in orange on the chart below highlight the contraction phase of a stock market cycle, and the green regions show the expansion phase. A contraction is defined by a time period when the stock market value declined from its peak by 10% or more. These declines seem to happen at random and last for varying time periods. Expansion measures the recovery of the index from the bottom of a contraction to its previous peak and the subsequent performance of the index until it reaches the next peak level before another 10% decline.
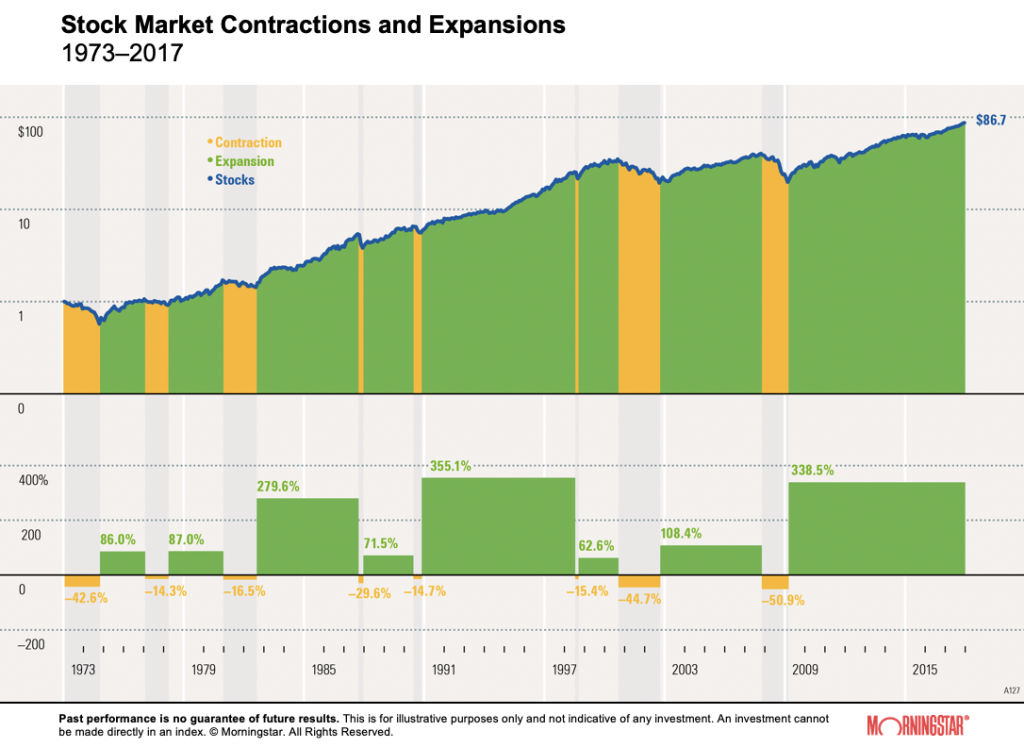
While some periods of decline have been severe, the market, overall, has grown with time. For instance, the stock market fell from its peak at month-end May 1990 to its trough in October 1990 by –14.7%, but grew by 355.1% from November 1990 to its next peak in June 1998.
You can’t drive your car well by only focusing on the closest lane marker, you have to look out. The same applies to successful investing.
Casey Smith is owner and president of Wiser® Wealth Management, a wealth management firm based in Marietta, GA. Wiser® Wealth Management helps clients identify, understand, and ...
more

