
Does A Decline In The 12 Month Moving Average Of Vehicle Miles Traveled Presage A Recession?
Mr. Steven Kopits writes:
But by and large, VMT on a 12 mms basis turns a bit before or right at the start of a recession.
I take the not seasonally adjusted vehicle miles traveled series extending back to 1970 and define a 12 month moving average variable. I think define a dummy variable that takes a value of 1 whenever this moving average term turns negative. This is plotted as blue bar in the graph below, with NBER defined recession dates shaded dark gray:
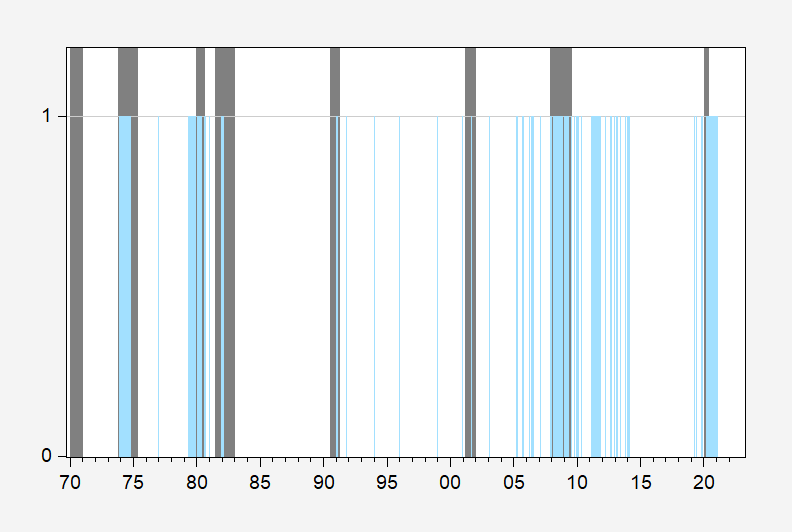
Figure 1: Months when 12 month trailing moving average of VMT declines (blue bar), and NBER defined recession dates (dark gray bars). Source: DOT FHA via FRED, NBER and author’s calculations.
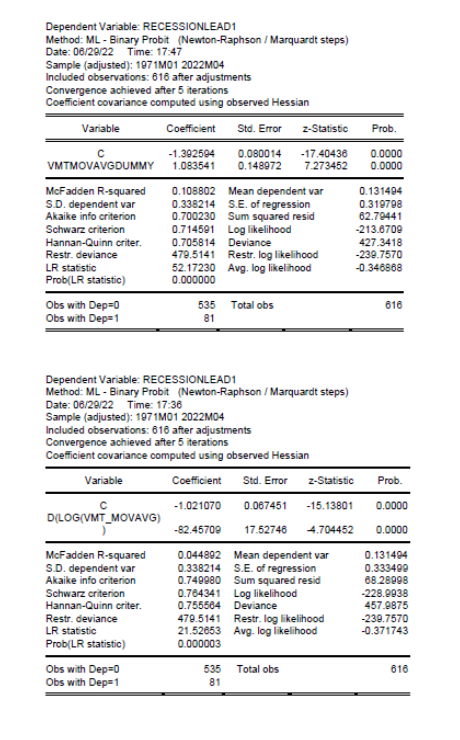
Using a one lag probit model, with negative 12 month trailing moving average of VMT dummy as a predictor, I predict recessions thusly:
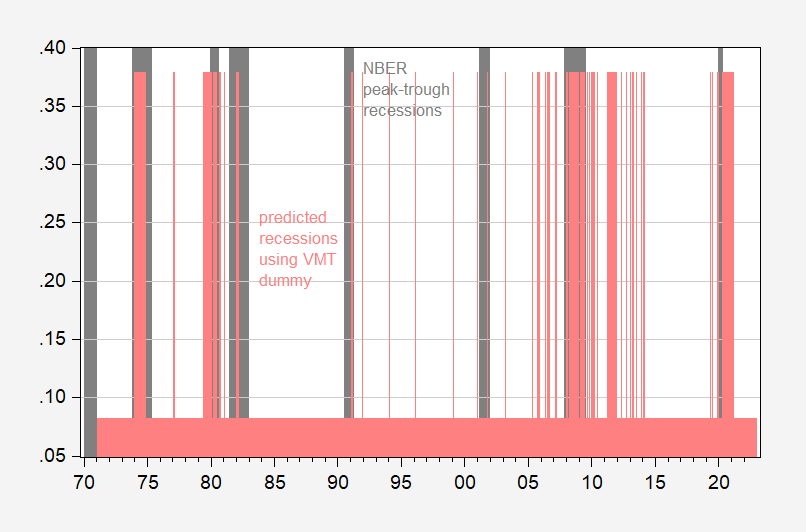
Figure 1: Implied probability of recession using dummy variable taking on value of unity when 12 month trailing moving average of vehicle miles traveled is negative, lagged one month (pink), and NBER defined peak-to-trough recession dates (gray bar). Source: NBER and author’s calculations.
The McFadden R2 from this regression is 0.11. The proportion of correct calls on recessions is 48% (using a threshold of 30% for predicting a recession). Regression output at end of post.
As is obvious, there are many false calls, exactly because there are numerous occasions where the 12 month moving average of VMT declines without an accompanying NBER-defined recession (of course, one could define recessions in a way to make the VMT variable predict perfectly; that would be to define recessions as the months after a decline in the 12 month moving average of VMT!)
What if we use actual change in the 12 month trailing moving average (lagged one month)? Then we get this picture.
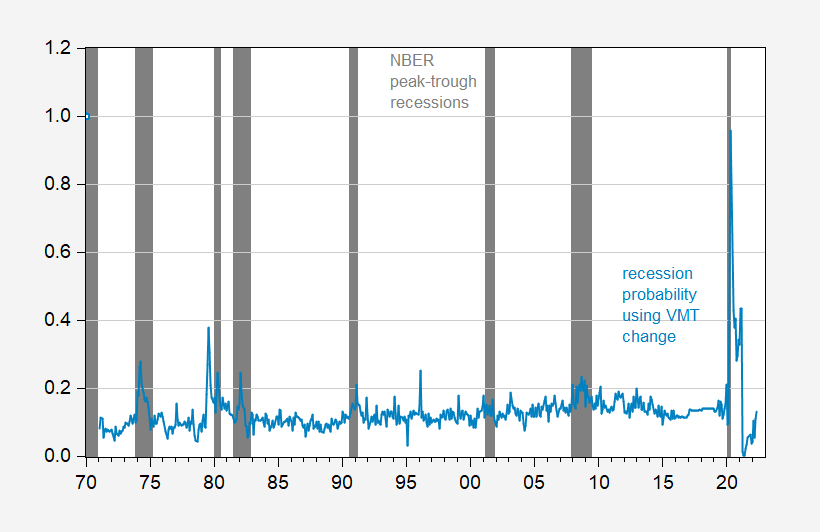
Figure 3: Implied probability of recession using 12 month trailing moving average of vehicle miles traveled, lagged one month (sky blue), and NBER defined peak-to-trough recession dates (gray bar). Source: NBER and author’s calculations.
The McFadden R2 from this regression is 0.04. The proportion of correct calls on recessions is 16% (using again a 30% threshold). Regression output at end of post.
Once again, not a particularly good predictor of recessions as defined by the NBER.
Addendum:
The VMT variable is a reasonable coincident indicator. A probit regression has a McFadden R2 of 7%, with 18% correct calls for recessions using a 30% threshold.
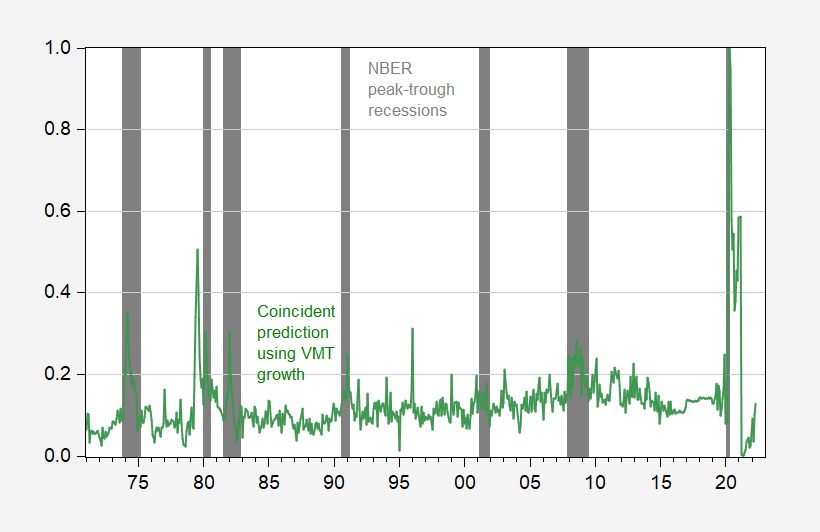
Figure 4: Implied probability of recession using 12 month trailing moving average of vehicle miles traveled, contemporaneously (green), and NBER defined peak-to-trough recession dates (gray bar). Source: NBER and author’s calculations.
Disclosure: None.


