
Do Nothing, Absolutely Nothing, Until...
The State of the Market: Executive Summary
Stocks are down again in the early going Monday as a new record high in daily coronavirus cases (as well as a new high for the 7-day average of new cases) here at home and in many places in Europe has caused traders to fear another phase of lockdowns. Yes, a vaccine appears to be coming - and faster than anyone could have imagined in March, when the pandemic started to roll through the country. The concern is that the exponential increase in cases will trigger new lockdowns, which would, of course, could put a serious dent in the economic recovery.
However, I think it is important to recognize that the stock market has been dealing with this for some time now as the S&P 500 has effectively been moving sideways since late August. And since hitting a fresh high in early September, the venerable blue-chip index looks like it has been experiencing a period of consolidation ever since. As such, the daily movement within the current trading range isn't necessarily meaningful - or a reason to take action.
Now mix in some election uncertainty - mainly over which team will control the senate - and you wind up with what I like to call a "sloppy period." And in my experience, the best way to play this type of market is to, "do nothing, absolutely nothing, until there is something to do." In other words, it probably isn't a good idea to react to every wiggle and giggle in the market at times like these (or ever, for that matter), and instead to stay focused on the big picture. Which is what our Monday morning review of my favorite primary cycle models is all about.
And with my Primary Cycle indicator board sporting an awful lot of green this week, my thinking is it is probably best to continue to give the bulls the benefit of any/all doubt when near-term problems arise.
The Big-Picture Market Models
There are no changes to report on the Primary Cycle board this week. As I've opined plenty of late, I believe the board is in good shape and supports the idea that stocks are currently in the midst of a cyclical bull market. To me, this suggests that investors with a longer-term time horizon should continue to side with the bull camp.
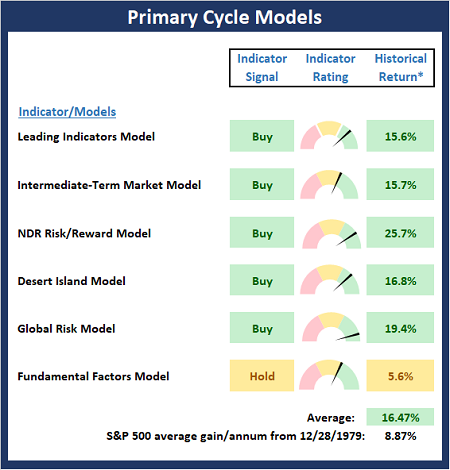
* Source: Ned Davis Research (NDR) as of the date of publication. Historical returns are hypothetical average annual performances calculated by NDR. Past performances do not guarantee future results or profitability - NOT INDIVIDUAL INVESTMENT ADVICE.
Checking On The "Primary" Cycles
While I don't often make portfolio adjustments based on the long-term trends in the stock market (aka the "primary cycles"), I have found over the years that checking in on state of the cycles and the weekly/monthly charts helps to keep the big-picture in perspective.
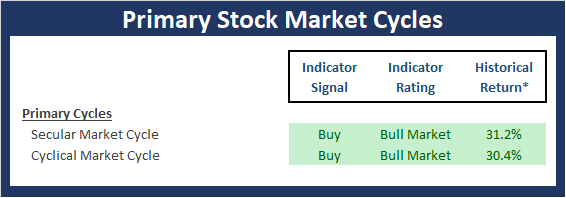
* Source: Ned Davis Research (NDR) as of the date of publication. Historical returns are hypothetical average annual performances calculated by NDR. Past performances do not guarantee future results or profitability - NOT INDIVIDUAL INVESTMENT ADVICE.
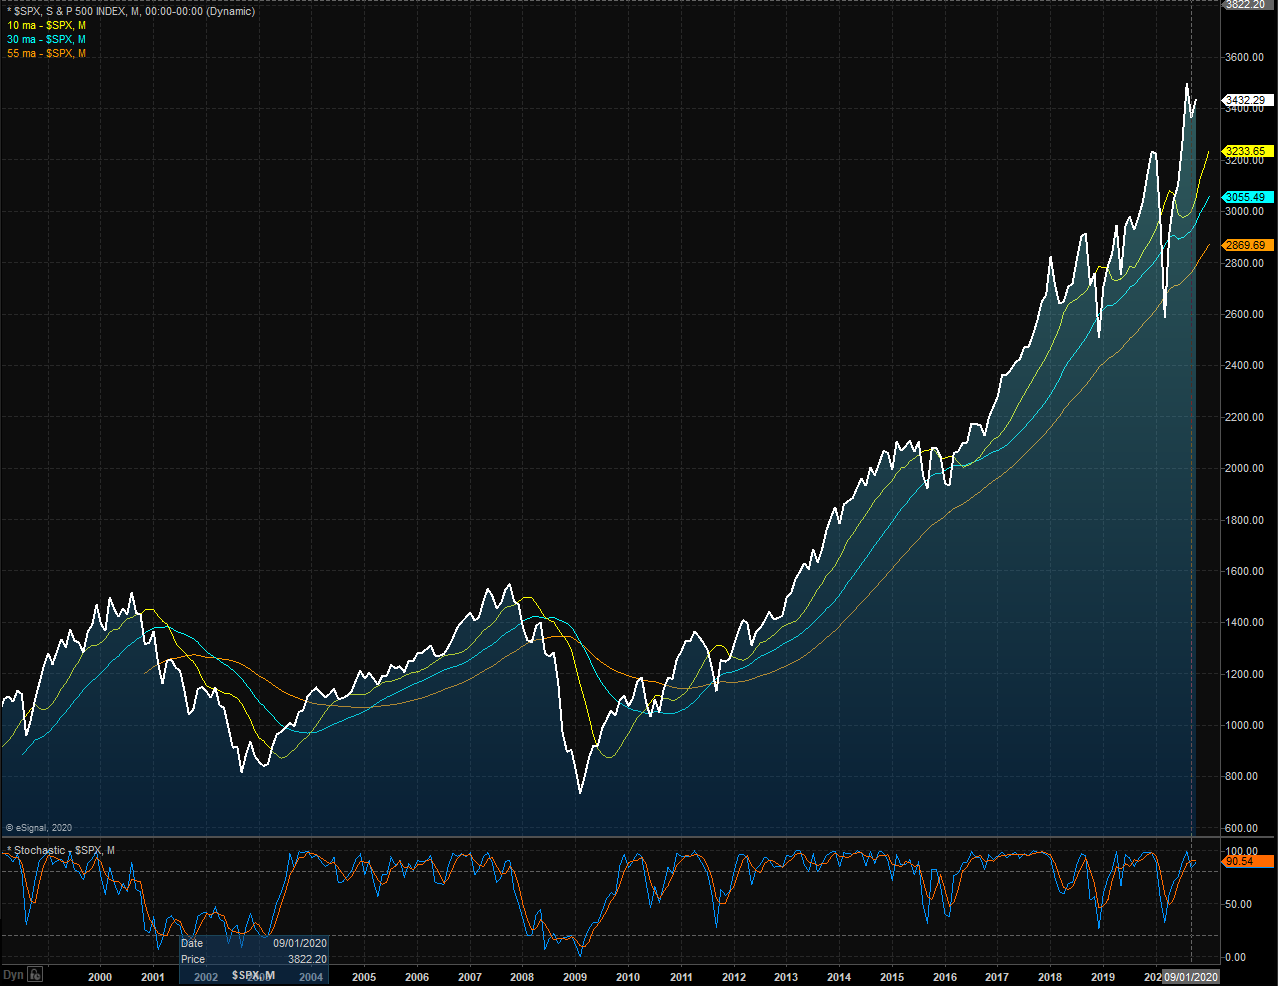
The Secular Market Cycle
Definition: A secular bull market is a period in which stock prices rise at an above-average rate for an extended period (think 5 years or longer) and suffer only relatively short intervening declines. A secular bear market is an extended period of flat or declining stock prices. Secular bull or bear markets typically consist of multiple cyclical bull and bear markets. Below is a monthly chart of the S&P 500 Index illustrating the current cycle, which we estimate began on March 9, 2009.
S&P 500 - Monthly
(Click on image to enlarge)
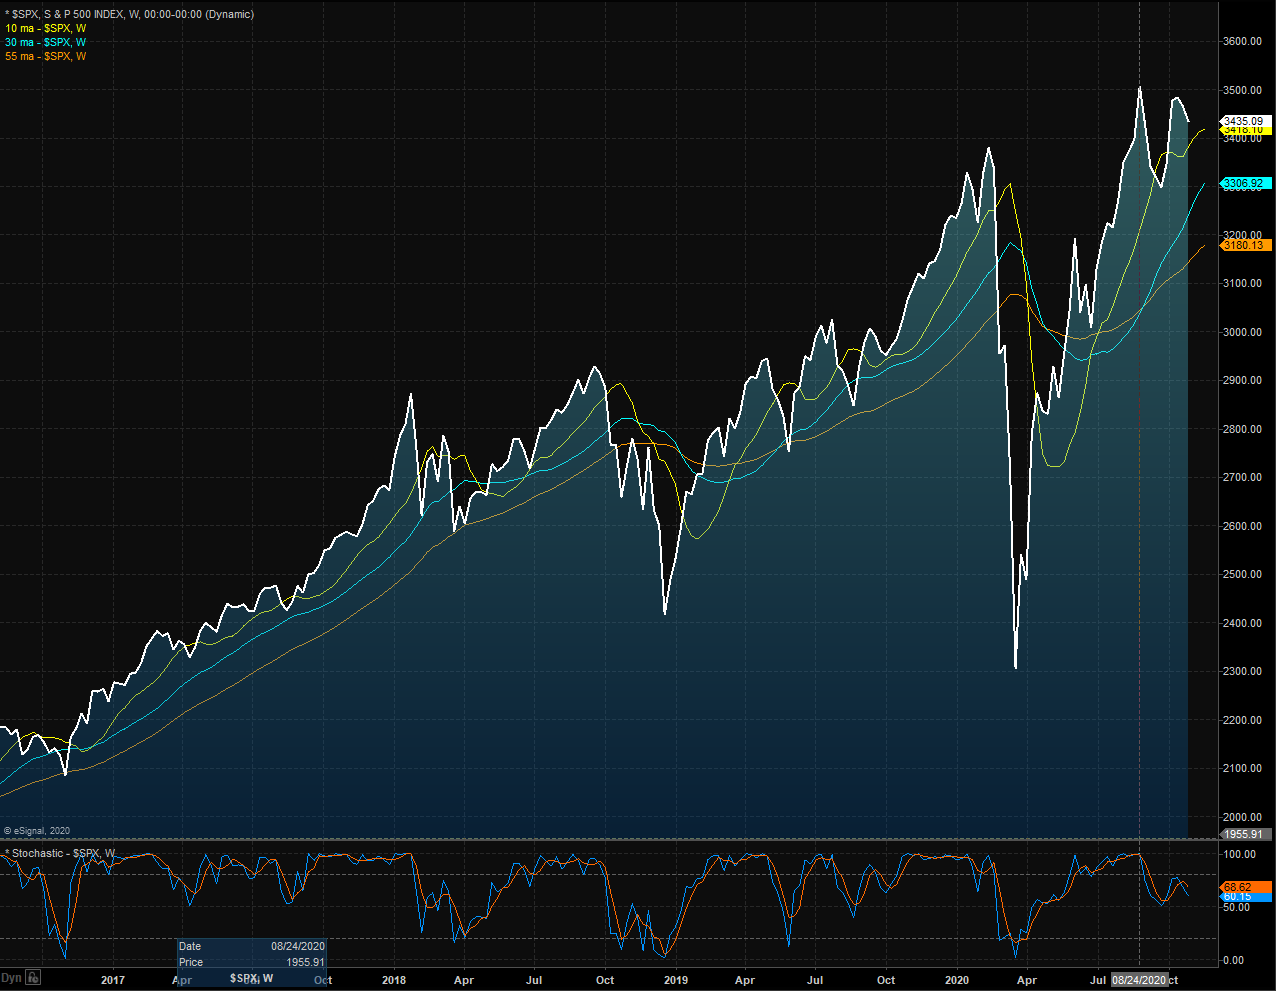
The Cyclical Market Cycle
Definition: A cyclical bull market requires a 30% rise in the DJIA after 50 calendar days or a 13% rise after 155 calendar days. Reversals of 30% in the Value Line Geometric Index since 1965 also qualify. A cyclical bear market requires a 30% drop in the DJIA after 50 calendar days or a 13% decline after 145 calendar days. Reversals of 30% in the Value Line Geometric Index also qualify. Below is a weekly chart of the S&P 500 illustrating the current cycle, which we estimate began on March 24, 2020.
S&P 500 - Weekly
(Click on image to enlarge)
Thought For The Day:
I've got a theory that if you give 100% all of the time, somehow things will work out in the end. -Larry Bird
The opinions and forecasts expressed herein are those of Mr. David Moenning and may not actually come to pass. Mr. Moenning's opinions and viewpoints regarding the future of the markets should ...
more

