
Did Strong December Payrolls Push Gold Prices Up?
December payrolls were strong – but gold prices rose. What happened?
Job Creation Surprises Positively
U.S. nonfarm payrolls accelerated in December, beating expectations. The economy added 312,000 jobs last month, following a rise of 176,000 in November (after an upward revision) and significantly above 182,000 forecasted by the economists. The number was the biggest increase since February 2018. On an annual basis, the pace of job creation increased slightly last month to 1.8 percent.
What is important is that the gains were widespread, but the most impressive expansion occurred in education and health services (+82,000), leisure and hospitality (+55,000) and professional and business services (+43,000).
Moreover, the strong headline number was accompanied by significant positive revisions in November and October. With those, employment gains in these two months combined were 58,000 higher than previously reported. In consequence, after revisions, job gains have averaged 254,000 per month over the last three months or 220,000 over the prior 12 months.
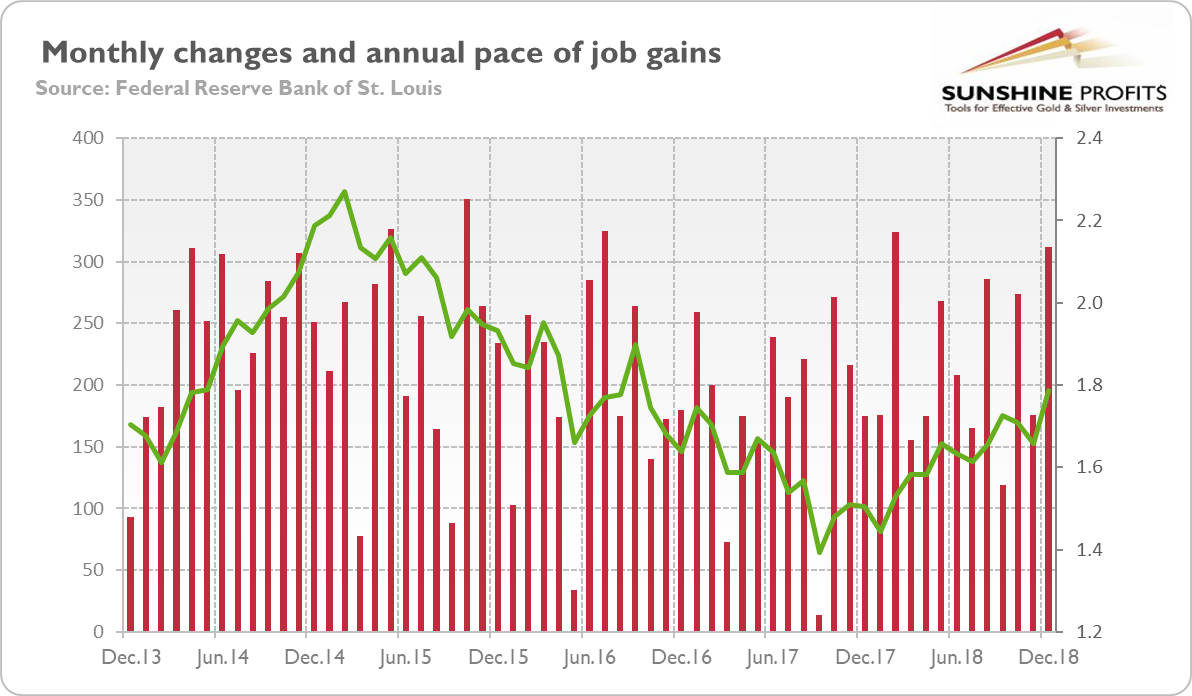
The chart below summarizes the US nonfarm payrolls over the last five years, showing both monthly and yearly changes. As one can see, the annual pace of job gains has been in upward trend since the fall of 2017, while the monthly gains are significantly above the level that would keep the unemployment rate in check and would please the Fed. Hence, the current economic expansion still has plenty of steam despite growing worries about the slowdown. It is not a good news for the gold bulls.
Chart 1: Monthly changes in employment gains (red line, left axis, in thousands of persons) and total nonfarm payrolls percent change from year ago (green line, right axis, % change from year ago) from December 2013 to December 2018.
Unemployment Rate Rises – And It’s Good
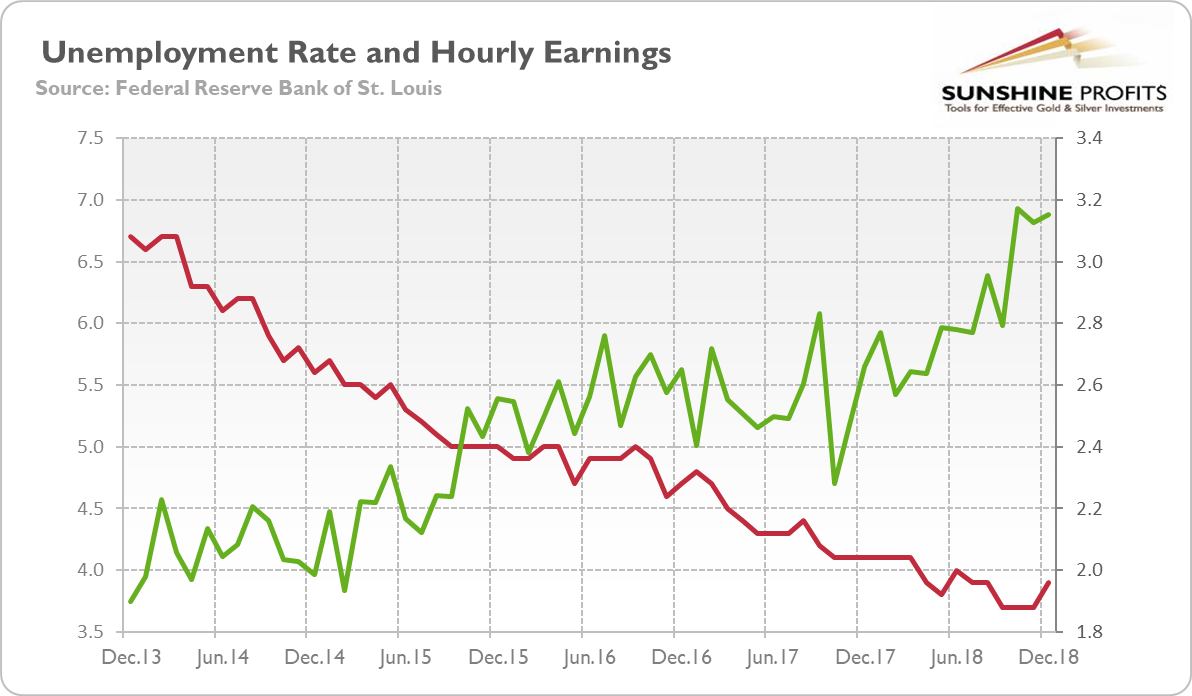
Wait a minute. You wrote that “the monthly gains are significantly above the level that would keep the unemployment rate in check,” but the unemployment rate rose from 3.7 to 3.9 percent in December, as one can see in the chart below.
Chart 2: Unemployment rate (red line, left axis, in %) and the average hourly earnings (green line, right axis, in %) from December 2013 to December 2018.
However, the jobless rate increased because more people entered the workforce. The labor force participation rate rose from 62.9 percent in November to 63.1 percent in December. It’s a good sign, as it shows that people who were previously outside the labor force now think work is easier to find and start to look for it. What is also important is that the number of long-employed people, workers employed part time for economic reasons and discouraged workers dropped from the year ago.
Moreover, the tightening of the labor market has also given workers more bargaining power over the wages. The average hourly earnings for all employees on private nonfarm payrolls rose by11 cents to $27.48. It implies that they increased 3.2 percent over the prior twelve months, slightly faster than last month, as the chart above shows. Rising wages should strengthen the hawkish camp among the Fed, recently less visible.
Implications for Gold
The December edition of the Employment Situation Report was strong. The payrolls surprised the analysts on positive side and were significantly above the level needed for a gradual tightening of the labor market. The unemployment rose, but only because more people entered the labor force, which is good for the economy. Last but not least, the wages continued to grow relatively fast.
All that means that that the reports about the death of the US economic expansion have been greatly exaggerated. The American labor market remains healthy, while inflation is under control. Hence, the FOMC should stay on track to continue gradually raising interest rates. The US will eventually fall into recession, but the December employment report confirms our fundamental analysis, included in the January edition of the Market Overview, that this isn’t going to happen anytime soon.
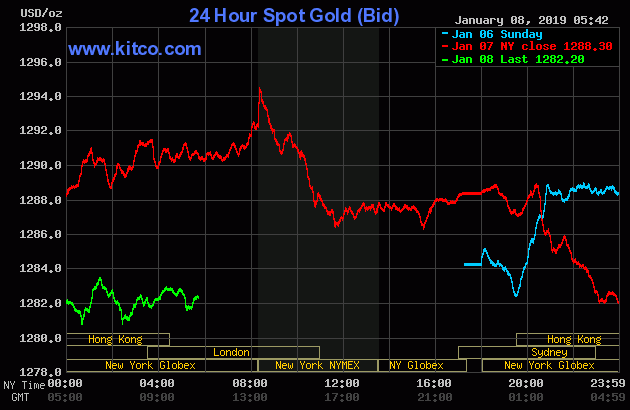
Gold should struggle, then. Instead, it rallied in January. As the chart below shows, it even jumped shortly above $1,290 yesterday.
Chart 3: Gold prices from January 6, 2019 to January 8, 2019.
What happened? Well, on Friday, Powell suggested that the Fed may become more dovish this year. He said that “with the muted inflation readings that we’ve seen, we will be patient as we watch to see how the economy evolves,” and that “we will be prepared to adjust policy quickly and flexibly and to use all of our tools to support the economy should that be appropriate to keep the expansion on track.” In plain English, it means that Powell capitulated to the financial markets and introduced the put. He gave them the message they wanted, raising the possibility of a pause in the Fed’s gradual tightening in response to downside risks and turmoil in the stock market. It should support the gold prices for some time, especially in January, which has been typically positive for the yellow metal.
If you enjoyed the above analysis and would you like to know more about the most important macroeconomic factors influencing the U.S. dollar value and the price of gold, we invite you to read the ...
more

