
December Dallas Fed Manufacturing Outlook At 2.5 Year Low
This morning the Dallas Fed released its Texas Manufacturing Outlook Survey (TMOS) for December. The latest general business activity index came in at -5.1, down a whopping 22 points from 17.6 in November. All figures are seasonally adjusted.
Here is an excerpt from the latest report:
Texas factory activity continued to expand rather modestly in December, according to business executives responding to the Texas Manufacturing Outlook Survey. The production index, a key measure of state manufacturing conditions, inched down one point to 7.3.
Perceptions of broader business conditions turned slightly negative in December. The general business activity index plummeted 23 points to -5.1, hitting its lowest level since mid-2016. The company outlook index also fell markedly, dropping 17 points to -3.4, also a two-and-a-half-year low. More than 20 percent of manufacturers noted their outlook worsened this month.
Expectations regarding future business conditions remained positive but retreated notably in December. The indexes of future general business activity and future company outlook fell 23 points to 3.2 and 8.8, respectively. Most other indexes for future manufacturing activity also posted double-digit declines this month but remained solidly in positive territory.
Monthly data for this indicator only dates back to 2004, so it is difficult to see the full potential of this indicator without several business cycles of data. Nevertheless, it is an interesting and important regional manufacturing indicator. The Dallas Fed on the TMOS importance:
Texas is important to the nation’s manufacturing output. The state produced $159 billion in manufactured goods in 2008, roughly 9.5 percent of the country’s manufacturing output. Texas ranks second behind California in factory production and first as an exporter of manufactured goods.
Texas turns out a large share of the country’s production of petroleum and coal products, reflecting the significance of the region’s refining industry. Texas also produces over 10 percent of the nation’s computer and electronics products and nonmetallic mineral products, such as brick, glass and cement.
Here is a snapshot of the complete TMOS.

The next chart is an overlay of the General Business Activity Index and the Future Outlook Index — the outlook six months ahead.

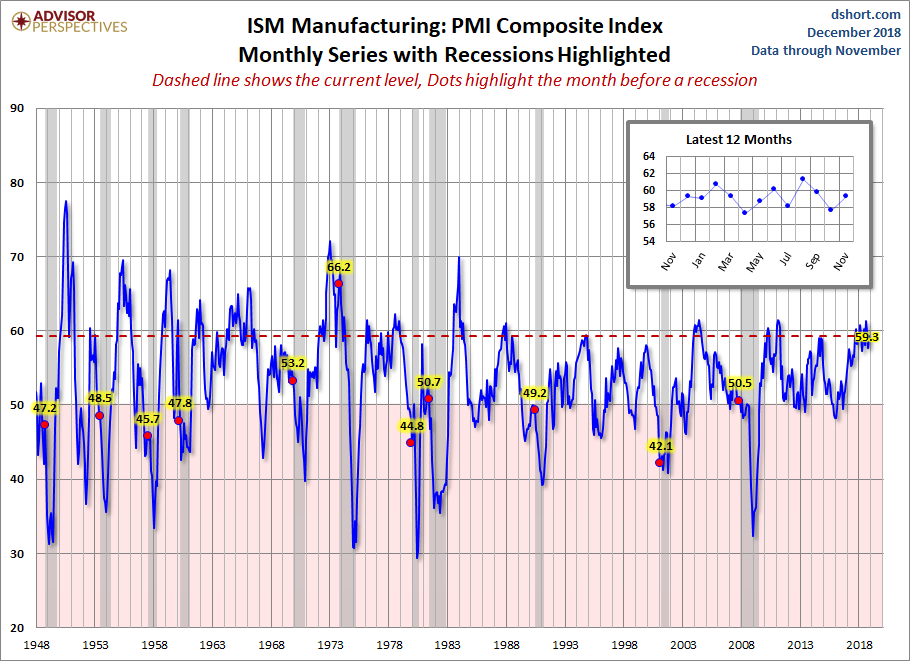
For comparison, here is the latest ISM Manufacturing survey.
Let's compare all five Regional Manufacturing indicators. Here is a three-month moving average overlay of each since 2001 (for those with data).

Here is the same chart including the average of the five for the latest month with complete data.


