
December 2018 Philly Fed Coincident Index Year-Over-Year Rate Of Growth Marginally Slows
The year-over-year rate of growth relative to the previous month of the US Coincident Index declined. A comparison of this US Coincident Index to other coincident indices follows.

Analyst Opinion of the Current Status of the Coincident Indicators
The reality is that most of the economic indicators have moderate to significant backward revision - and this month they are generally showing slowing growth. Out of this group of coincident indicators discussed in this post, only ECRI and the Aruoba-Diebold-Scotti business conditions index have no backward revision - and both have a good track record of seeing the economy accurately in almost real time.
Economic indicators that coincide with economic movements are coincident indicators. Coincident indicators by definition do not provide a forward economic view. However, trends are valid until they are no longer valid, making the trend lines on the coincident indicators a forward forecasting tool.
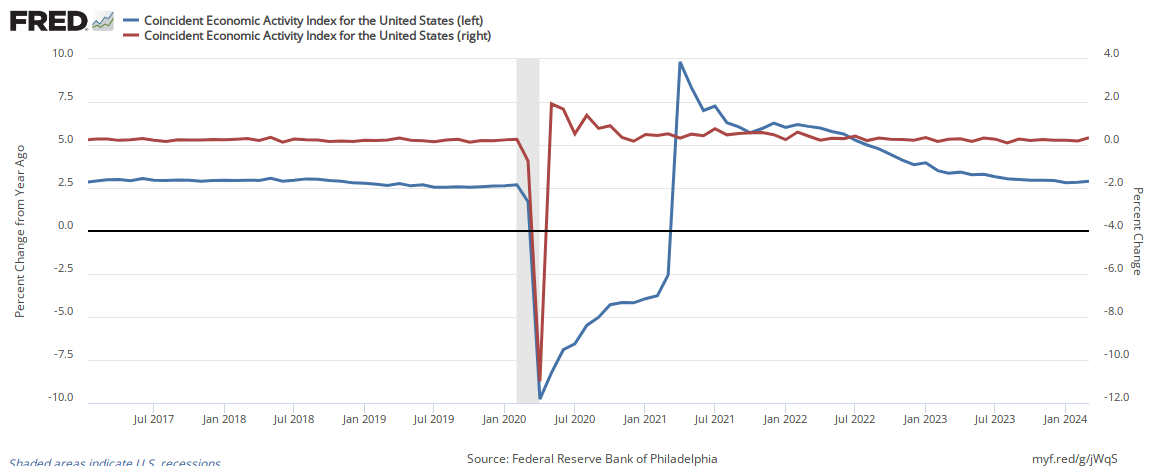
Excerpt from Philly Fed Report for the United States Coincident Index
The Federal Reserve Bank of Philadelphia has released the coincident indexes for the 50 states for December 2018. Over the past three months, the indexes increased in 47 states, decreased in two states, and remained stable in one, for a three-month diffusion index of 90. In the past month, the indexes increased in 38 states, decreased in three states, and remained stable in nine, for a one-month diffusion index of 70. For comparison purposes, the Philadelphia Fed has also developed a similar coincident index for the entire United States. The Philadelphia Fed's U.S. index increased 0.7 percent over the past three months and 0.2 percent in December.

In the graph below, the blue line shows the year-over-year growth rate of the US Concident Index, while the red line shows the month-over-month change. The year-over-year trend is down.
(Click on image to enlarge)
Aruoba-Diebold-Scotti Business Conditions Index
(Click on image to enlarge)

Per the Philly Fed:
The Aruoba-Diebold-Scotti business conditions index is designed to track real business conditions at high frequency. Its underlying (seasonally adjusted) economic indicators (weekly initial jobless claims; monthly payroll employment, industrial production, personal income less transfer payments, manufacturing and trade sales; and quarterly real GDP) blend high- and low-frequency information and stock and flow data. Both the ADS index and this web page are updated as data on the index's underlying components are released.
The average value of the ADS index is zero. Progressively bigger positive values indicate progressively better-than-average conditions, whereas progressively more negative values indicate progressively worse-than-average conditions. The ADS index may be used to compare business conditions at different times. A value of -3.0, for example, would indicate business conditions significantly worse than at any time in either the 1990-91 or the 2001 recession, during which the ADS index never dropped below -2.0.
The vertical lines on the figure provide information as to which indicators are available for which dates. For dates to the left of the left line, the ADS index is based on observed data for all six underlying indicators. For dates between the left and right lines, the ADS index is based on at least two monthly indicators (typically employment and industrial production) and initial jobless claims. For dates to the right of the right line, the ADS index is based on initial jobless claims and possibly one monthly indicator.
Conference Board's Coincident Index (red line):
(Click on image to enlarge)

ECRI's USCI (U.S. Coincident Index):
(Click on image to enlarge)

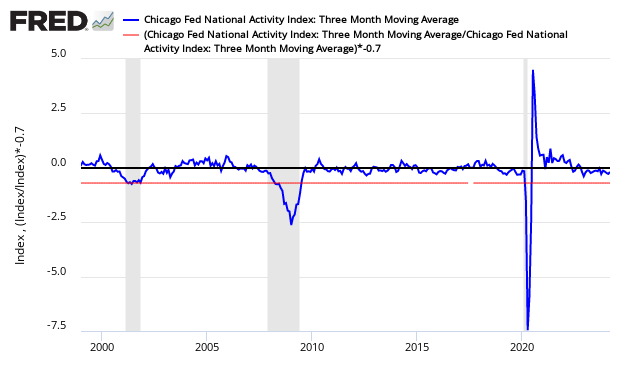
Chicago Fed National Activity Index (CFNAI)
(Click on image to enlarge)
Summary
Generally the coincident indices are showing modest growth. Econintersect's analysis of the coincident indices is that:
- The Philly Fed US Coincident index year-over-year rate of growth declined - but the index remains above average for values seen over the last two years.
- The Aruoba-Diebold-Scotti business conditions shows above average business conditions.
- The rate of growth of the Conference Board Coincident Index is stable with with little change in the rate of growth.
- ECRi's Coincident Index's rate of growth marginally declined - but remains about average for the values seen in the last 12 months.
- The CFNAI rate of growth is above the historical trend rate of growth (zero line) - but its growth rate is slowing.
Disclaimer: No content is to be construed as investment advise and all content is provided for informational purposes only.The reader is solely responsible for determining whether any investment, ...
more

