
Debt And Profit In Russell 2000 Firms

This week, the Supply and Demand Report featured a graph of debt vs profitability in the Russell 2000. Here’s the graph again:
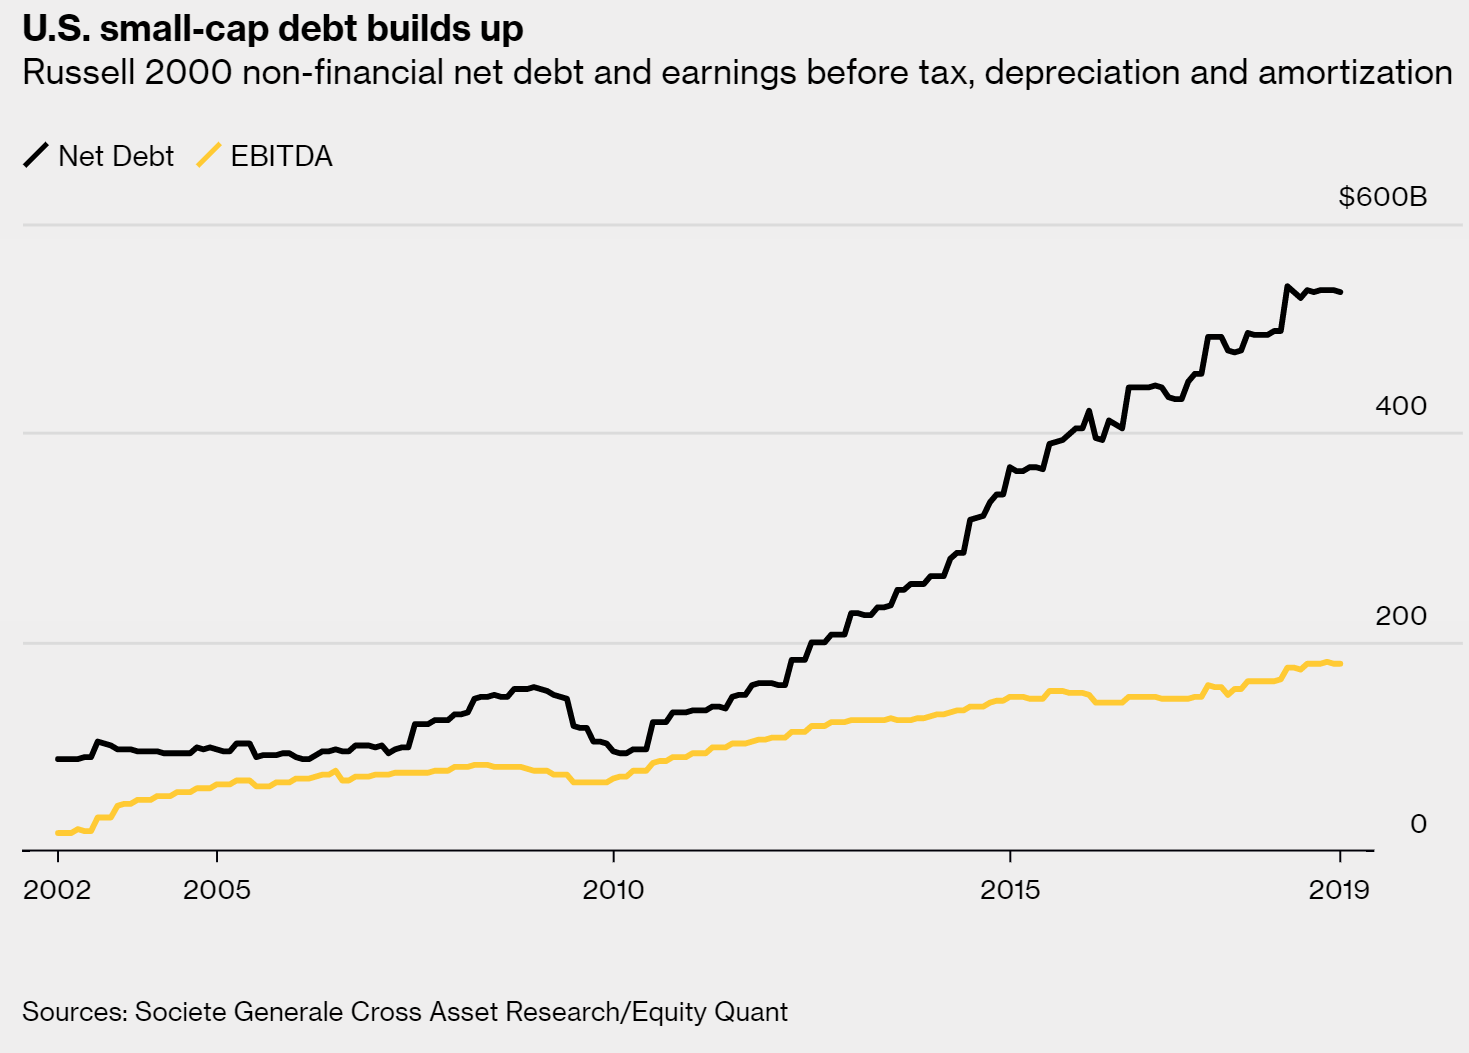
This graph shows a theme that we, and practically no one else(!) have been discussing for years. It is the diminishing marginal utility of debt. In this case, more and more debt is required to add what looks like less and less profit (we don’t have the raw data, only the graphic).
We do not view the coming end of this incredible false boom in biblical terms, nor in a malevolent sense, that man gets his comeuppance for daring to build something. We don’t see it as inevitable that what goes up must come down. And we don’t believe that all good things come to ruin in the end.
We see it as math’s revenge.
It gets back to our definition of inflation: the counterfeiting of credit. It’s a fraud, where the lender often does not know or approve of giving credit—and more importantly, the borrow lacks the means and intent to repay.
It may not be inevitable for growth to shrink, but as the sun rises in the east, debt borrowed without means to repay will be defaulted.
Here is another graph to consider:
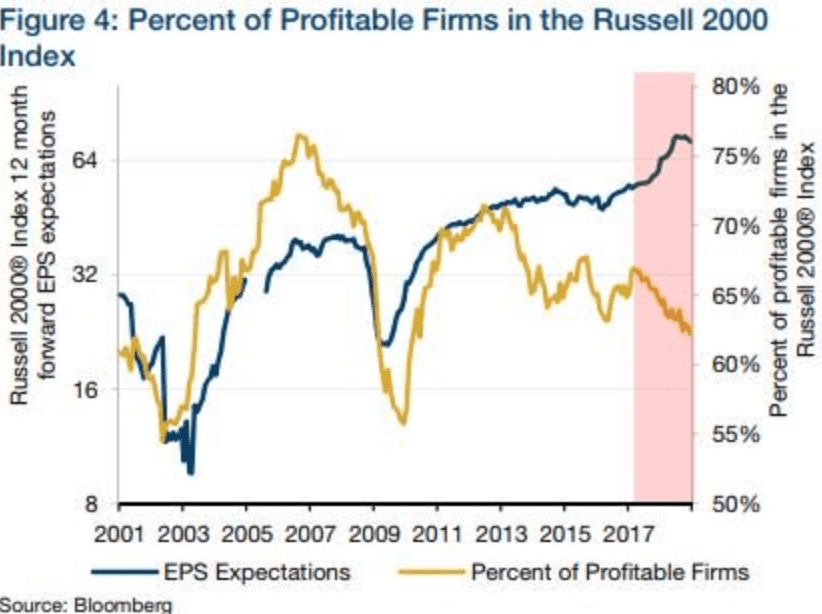
Most commentary around this graph focuses on the contradiction that analysts expect rising profits while the percentage of firms that actually generate a profit is falling. And this contradiction will not be resolved in favor of those who put their money where those analysts mouths are. This graph shows a symptom of the Fed’s incredible misallocation of credit.
We are in an economy that all acclaim to be “strong” and “healthy”. Debt is rising, as is GDP and employment. Yet a shrinking proportion of small-cap stocks (weighted average market cap is over $2B) actually generate a profit. Let’s restate that, despite the free flow of credit-effluent, despite the incredible boost to GDP of incredible central bank-fueled debt, more and more of these companies cannot generate a profit. And if this downturn in the profitable proportion of the index is durable, observe that the peak is lower than prior to the last bust.
The spending of one company is the revenues of another. But regardless, close to four in ten of these companies now fail to generate earnings. And this is also despite a variety of ways to consume capital and report it as earnings. Such as neglecting employee training and cutting back on preventative maintenance.
We won’t speculate how many of these firms will be unprofitable in the next bust cycle, other than to note that in the last one, it was about 45%. In the next one, this number will be worse.
Our point today is that the Fed and other central banks have caused a misallocation of credit of enormous proportions. The Fed has induced speculators to bid up the shares of money-losing companies. Obviously, the return they expect will not come from operating the business. Their gain will be provided by the next speculator. It may sound crazy, but it has worked brilliantly since 2009.
It cannot work forever, because a money-losing company is, well, losing money. Some may get acquired by larger firms in an attempt to find synergies or at least cost savings. However, in a world of falling interest rates, there will always be another competitor who finds it attractive to jump into your business on the next rate downtick.
And the interest rate trend remains downward. It has to (and we have written many pieces on the causes). Otherwise, then interest expense will quickly spiral out of control. Not just for the marginal company in the Russell 2000, but for everyone. And Uncle Sam will be last to fall.


