
Danger Zone: Qlik Technologies
Being slow to market, or failing to meet new customer demands can have a significant negative impact on a firms operations. In high growth and highly profitable industries, competition eventually enters the market and leaves those laggards behind. Despite deteriorating margins, lack of competitive advantage, and a sky-high valuation, Qlik Technologies (QLIK: $31/share) is up nearly 33% over the past two years and finds itself in the Danger Zone this week.

Qlik’s Profits Have Disappeared
Qlik went public in 2010, and in that year generated an after-tax profit (NOPAT) of $20 million. Since then, NOPAT has declined each year and reached -$6 million over the most recent trailing-twelve-months (TTM). This deterioration of profits has come amidst strong revenue growth, but unfortunately, as the business has expanded, it has become ever more costly to run. Figure 1 shows how Qlik’s NOPAT margins have declined from 9% in 2010 to -1% in the TTM.
Figure 1: Margin Destruction Offsets Revenue Growth
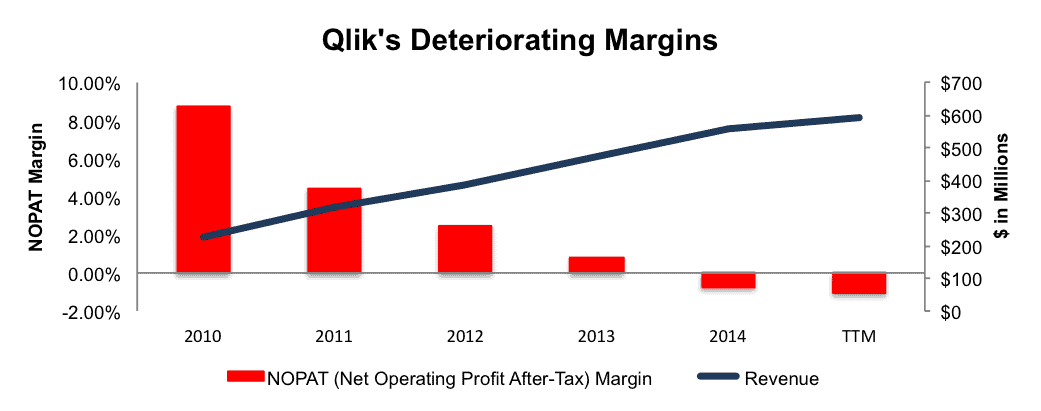
Sources: New Constructs, LLC and company filings
We mentioned strong revenue growth above, and Qlik has grown revenues by 25% compounded annually since 2010. However, the company’s cost of growing revenue, which includes cost of sales, sales & marketing, research & development, and general & administrative expenses have grown at 33%, 25%, 51%, and 32% compounded annually respectively over this same timeframe.
Following the same troubling trend is Qlik’s return on invested capital (ROIC), which has fallen from a once impressive 48% in 2010 to its current bottom quintile -5%. No matter which way you look at Qlik, it is clear to see that this once profitable business model has been deteriorating for quite some time as it has grown and faced tougher competition.
Competitors Have Surpassed Qlik
Qlik’s technology was built to allow enterprise users to visualize and analyze data in real-time. The company built a profitable niche in the business intelligence market by providing easy access to its product, Qlikview, and upselling customers who had seen the benefits of using Qlikview. However, as the business intelligence market grew, customers outside the traditional IT market required an easier, more user-friendly solution. Since Qlik operated with high profitability, it comes as no surprise that new competition arose from start-ups to industry stalwarts committing additional resources to develop similar products to new open-source programs. Qlik was slow to react, and only released its “non-IT” product in late 2014. As it stands now, Qlik’s ROIC of -5% ranks well below that of its competition. In such a highly competitive market and with the lowest profitability in its market, Qlik can ill afford to compete on price while keeping up with competition.
Figure 2: Qlik’s Profitability Is Lacking
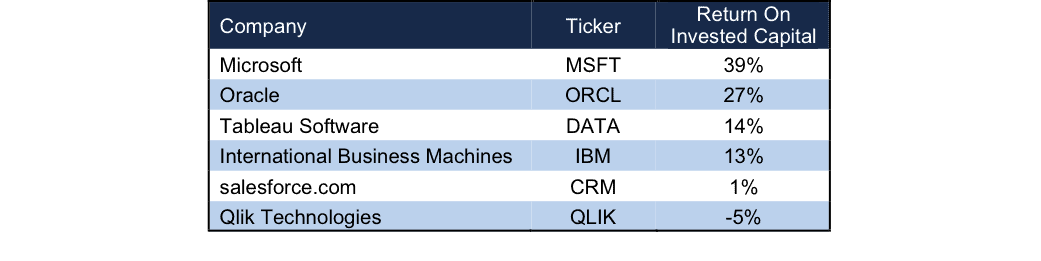
Sources: New Constructs, LLC and company filings
Bull Case Ignores Old and New Competition
While bulls seemingly look past the problems with Qlik’s business operations, they peg their hopes to the company achieving profitability through the introduction of their new QlikSense product, which as noted above, occurred in 2014. This product is tailored to allow users to create their own data visualization and requires less technical know-how than their initial product Qlik View. We are not here to argue the usefulness of Qlik’s product, but rather that competition has taken their once market lead and without a change to their business model, we find it difficult to see where profitability comes from. As of 3Q15, Qlik had 37,000 customers, while Tableau, which was founded 10 years after Qlik already has over 35,000, which highlights the ability of Tableau to capitalize on the market.
Going forward, Qlik has few options. They already offer their new Qlik Sense product as a free desktop download, which could signal demand was not at strong as hoped or that, without a free offering, Qlik couldn’t compete within the market. If Qlik wants to keep up or surpass the competition’s offerings, it will have to continue pouring money into R&D, thereby further driving down margins, or at best maintaining the current negative margin. Lastly, Qlik could look to raise prices and risk losing the market share they already possess. No matter how good a product a firm provides, if it sells for $1 but costs $2 to develop, run, and maintain, that company’s business model is broken. As it stands now, Qlik is selling a product at a loss, as exhibited by its declining NOPAT amidst growing revenues, but still losing ground to competition.
Compounding the above issues, bulls have driven Qlik’s valuation to levels that would imply significant profit growth. Unfortunately for these bulls, just occupying the business intelligence space will not be enough to propel Qlik higher.
Valuation Is Astronomical
Despite the clear decline in Qlik’s business operations, investors have chosen to ignore it and invest in QLIK on the expectation that a growing industry will include all players in the segment. However, this unwarranted exuberance has driven shares to levels that are more than unrealistic. To justify its current price of $31/share, Qlik must increase its pre-tax margin to 10% (currently -2%) andgrow revenues by 20% compounded annually for the next 16 years. In this scenario Qlik would, after 16 years, generate $8.6 billion in revenue, which is greater than salesforce.com’s 2014 revenue.
Even if we take a bullish approach, and assume that Qlik can achieve its best ever pre-tax margins of 13% (achieved in 2010) and grow revenues by 18% (around double the expected industry growth rate according to Gartner) for the next 10 years, the stock is only worth $21/share today – a 32% downside.
Even Overvalued Including Acquisition Premium
With such optimistic expectations embedded in the current stock price, investors are likely pricing in an acquisition premium. Investors should not be so hopeful that an acquisition will occur as in addition to the overvalued shares, Qlik has hidden liabilities that make the company more expensive than the accounting numbers suggest.
- $99.8 million in outstanding employee stock options ( 3% of market cap)
- $63.4 million in off-balance sheet operating leases (2% of market cap)
If we assume a competitor acquires Qlik, we can create different scenarios to determine a reasonable price such a suitor should pay.
- Microsoft acquires Qlik and upon acquisition Qlik immediately achieves Microsoft’s margins and ROIC. In this case, Qlik would still have to grow revenues by 18% compounded annually for the next eight years. A more realistic price Microsoft should pay for Qlik is $16/share, which is the value Qlik’s business based on the value of the firm if it achieves Microsoft’s 21% NOPAT margin in year 1 of the acquisition.
- IBM acquires Qlik and upon acquisition Qlik immediately achieves IBM’s margins and ROIC. In this case, Qlik would still have to grow revenues by 25% compounded annually for the next 16 years. A more realistic price IBM should pay for Qlik is $8/share, which is the value of Qlik’s business based on the value of the firm if it achieves IBM’s 15% NOPAT margin in year 1 of the acquisition.
Catalyst: Strengthening Competition Continues To Erode Qlik’s Business
As investors realize Qlik Technologies is the weakest link in the new business intelligence market, shares could see significant downside risk. As Tableau continues to outperform in terms of revenue and profits, and Microsoft, IBM, Oracle, and Salesforce continue building out their business intelligence applications, the landscape will only become more difficult for Qlik.
The first shoe may have already dropped when, in 3Q15, Qlik reported licensing revenue grew only 3% year-over-year and guided revenues lower for 4Q15 and the stock fell 13%. Merely two weeks later, Tableau reported licensing revenue had grown 57% YoY and expected Q4 revenue to come in above consensus estimates.
One other catalyst to look out for is the recent introduction of Amazon Web Services’ QuickSight, a cloud based data visualization application made to compete with Qlik and Tableau among others. Amazon has a reputation for driving prices and margins down as low as possible to force competitors out of business, and the company claims QuickSight will cost 1/10th as much as rival products. The effects of QuickSight may not be clear for a few months, but if they’re anything like Amazon’s effect on retail, QuickSight might make quick work of Qlik Sense.
Insider Sales and Short Interest Remain Low
Over the past 12 months 80,000 shares have been purchased and 300,000 shares have been sold for a net effect of 220,000 insider shares sold. These sales represent <1% of shares outstanding. Additionally, there are 6 million shares sold short, or 6% of shares outstanding.
Executive Compensation Raises (BIG) Non-GAAP Red Flag
In addition to base salaries, Qlik’s executives receive annual cash bonuses based upon meeting consolidated revenue and non-GAAP operating profit targets. In the latest Proxy Statement, the compensation committee has stated that “over the past three years, we have increased our emphasis on non-GAAP operating profit and we now reward our executive officers for over-performance of this key financial measure.” Unfortunately for investors, as Qlik’s business has declined, executive’s pay has not only increased, but greater emphasis has been placed upon metrics that are easier to manipulate to get more pay. Not coincidentally, Qlik’s calculation of non-GAAP operating income removes stock based compensation, which totaled $36 million (6% of revenue in 2014). Using ROIC would be a much better measure to base executive compensation as it holds executives accountable to shareholders and has a proven correlation to value creation.
Impact of Footnotes Adjustments and Forensic Accounting
We have made several adjustments to Qlik’s 2014 10-K. The adjustments are:
Income Statement: we made $21 million adjustments with a net effect of removing $20 (4% of revenue) million in non-operating expenses. We removed less than $1 million in non-operating income and $21 million in non-operating expenses.
Balance Sheet: we made $324 million of balance sheet adjustments to calculate invested capital with a net decrease of $189 million. The most notable adjustment was the inclusion of $64 million related to off balance sheet operating leases. This adjustment represented 19% of reported net assets.
Valuation: we made $455 million of adjustments with a net effect of increasing shareholder value by $128 million. The most notable adjustment to shareholder value was the removal of $99 million due to outstanding employee stock options. This adjustment represents 4% of Qlik’s market cap.
Dangerous Funds That Hold QLIK
The following fund receives our Dangerous rating and allocates significantly to Qlik Technologies.
Disclosure: New Constructs staff receive no compensation to write about any specific stock, sector, or ...


