
Crude Oil Prices Shrug Off OPEC Chatter, Drop On Fed Outlook
Crude oil prices shrugged off chatter about a possible OPEC output cut in 2019, dropping as the US Dollar pushed upward ahead of FOMC monetary policy announcement. The Greenback’s ascent echoed a steepening of the priced-in rate hike path implied in Fed Funds futures, hinting that investors were positioning for the possibility of a hawkish outcome.
In relative terms, they were not disappointed. A conspicuously brief policy statement highlighted “strong” economic activity and mentioned nothing of October’s brutal risk aversion, signaling that such market turmoil will not derail the tightening cycle. That pushed the US unit higher still, making for the largest daily gain in two weeks. Not surprisingly, anti-fiat gold prices also suffered against this backdrop.
COMMODITIES MAY PAUSE TO CONSOLIDATE BEFORE WEEK-END
Looking ahead, a period of consolidation may be in order. The economic calendar is relatively mild, with PPI data and the University of Michigan gauge of consumer confidence gauge out of the US unlikely to make a dent in the Fed outlook so soon after an FOMC meeting. A strong lead from risk trends absent in the meanwhile as bellwether S&P 500 futures idle.
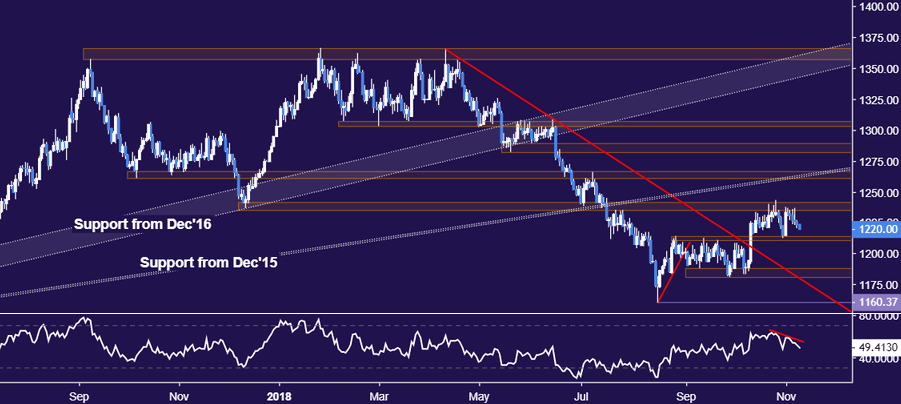
GOLD TECHNICAL ANALYSIS
Gold prices continue to drift lower toward range support in the 1211.05-14.30 area. A daily close below that opens the door for a challenge of the 1180.86-87.83 zone. Range resistance is in the 1235.24-41.64 region, with a break above that targeting the 1260.80-66.44 price band next.
(Click on image to enlarge)
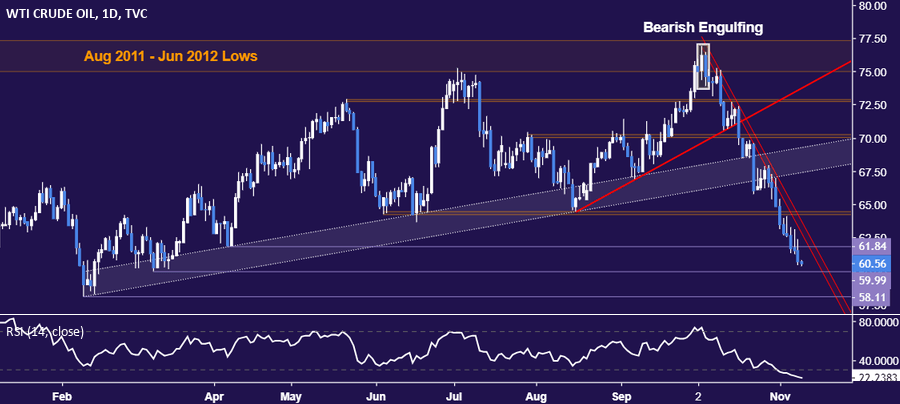
CRUDE OIL TECHNICAL ANALYSIS
Crude oil prices are on pace to deliver the tenth consecutive daily loss, marking the longest losing streak in over two years. Sellers now aim to challenge the $60/bbl figure, with a daily close below that opening the door for a challenge of the February 9 low at 58.11. Alternatively, a move back above support-turned-resistance at 61.84, April 6 low, targets a falling trend line at 63.63. Longer-term positioning points to a major top in place.
(Click on image to enlarge)
Disclosure: Do you want to see how retail traders are currently trading the US Dollar? Check out our IG Client Sentiment ...
more

