Crude Oil Prices Risk Deeper Losses After Support Break
Sentiment-sensitive crude oil prices plunged alongside stocks as risk aversion swept financial markets in Wall Street trade. Gold prices managed an upswing as the slump in sentiment weighed on bond yields and the US Dollar edged down, boosting the appeal of anti-fiat and non-interest-bearing alternatives.
A downshift in the priced-in 2019 Fed rate hike outlook looks to have accounted for the Greenback’s weakness, tepid though it was. Futures-implied expectations now envision 17bps in tightening next year, meaning traders are questioning the likelihood of even one increase.
CRUDE OIL EYES API DATA, GOLD MAY STALL BEFORE FED RATE DECISION
Looking ahead, API inventory flow data is in focus. The outcome will be sized up relative to expectations looking for a 3.2-million-barrel drawdown to be reported in official EIA statistics Wednesday. A larger outflow may boost prices while a smaller one – or even a surprise build – is might see them extend downward.
As for gold, directional progress might grind to a halt as markets await the FOMC monetary policy announcement. That seems likely to clash with the recent dovish shift in expectations however as the US central bank reasserts its hawkish credentials.
GOLD TECHNICAL ANALYSIS
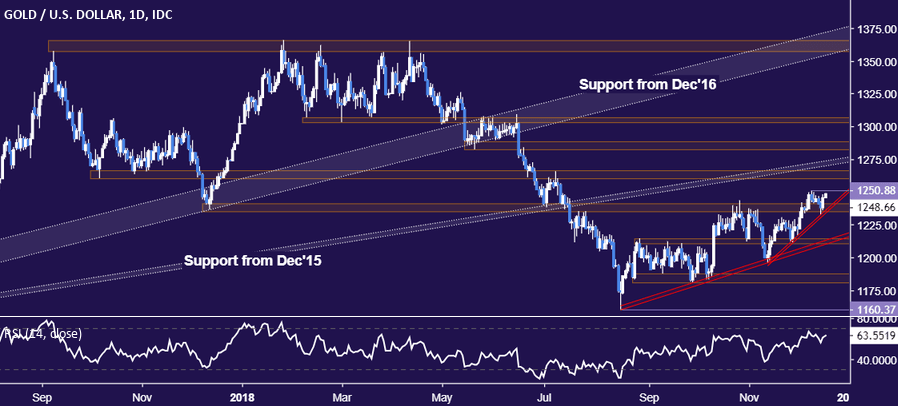
Gold prices bounced from resistance-turned-support in the 1235.24-41.64 area. From here, a daily close above the December 10 high at 1250.88 opens the door for a test of the 1260.80-66.44 zone. Alternatively, a reversal below targets rising trend line support 1211.57.
(Click on image to enlarge)

CRUDE OIL TECHNICAL ANALYSIS
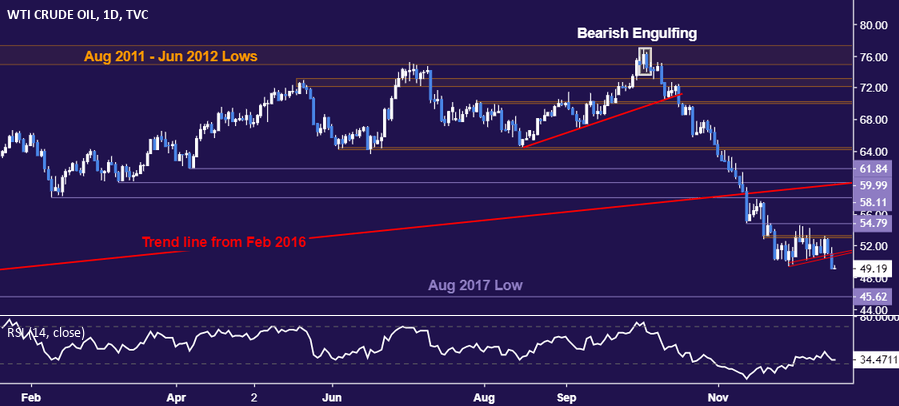
Crude oil prices appear to have restarted the dominant down trend with a break below counter-trend line support set from late November. The next noteworthy level of support comes in at 45.62, a swing bottom dating back to August 2017. Alternatively, a move back above trend line support-turned-resistance – now at 51.19 – exposes the range top in the 53.06-35 area.
(Click on image to enlarge)

Disclosure: Do you want to see how retail traders are currently trading the US Dollar? Check out our IG Client Sentiment ...
more


