
Crude Oil Breaks Down – Target $40
(Click on image to enlarge)
Our incredible ADL predictive modeling system predicted a moderate price anomaly on July 10th, 2019 in Crude Oil. We wrote about this oil set up on July 10th. Within this article, we suggested that Crude Oil would rotate to levels near $47~$48 rather quickly, then find some moderate support in December and January where support is likely to be found near $45 to $50. After that, the price of Oil should weaken dramatically where price could fall to levels below $30 ppb on extreme price weakness.
We are writing to you today to suggest that Oil prices may attempt to find very brief support near $55.25 as this level represents a key price trigger level which acts as support/resistance. After such a big downside move for the week, it is our opinion that Oil will briefly hold near this $55.25 level as oil tries to hold support for a couple of days.
We believe the selling may abate or weaken slightly early next week as earnings continue to hit the news cycle and future expectations are adjusted based on this data. Quite a bit of data will be released next week with the worlds biggest firms releasing Q2 data and Q3 expectations. We believe this news/data will result in a brief pause in the decline of oil prices and allow traders to set up for the next move lower.
The chart below also highlights our Fibonacci price modeling tool that is currently suggesting support will be found just above $51 ppb – which is aligned with the previous price bottom in early June 2019. Mild resistance is also found near $56.70 (the BLUE projected price level). This level will likely act as a “congestion range” as price rotates and attempts another downside leg.
(Click on image to enlarge)

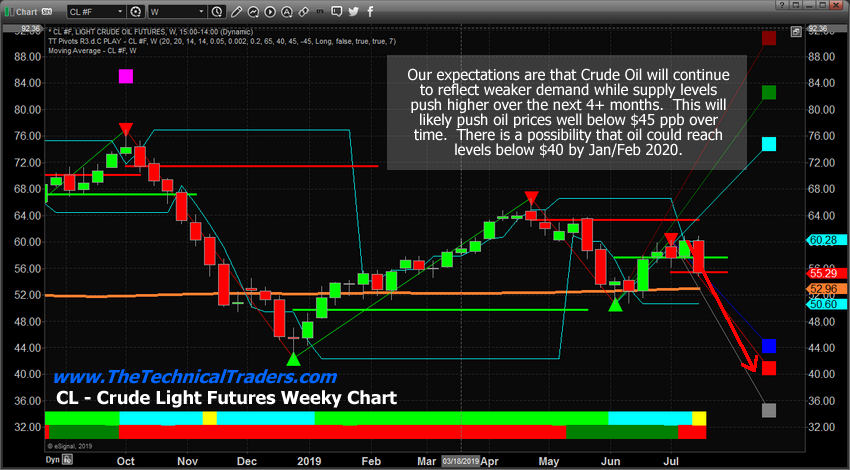
This Weekly Crude Oil chart highlights the bigger picture for oil. The recent breakdown in price has just crossed the Bearish Fibonacci trigger level (RED LINE near $55.20) and this breach suggests the downside price move may just be starting. Ultimate downside targets near $40 to $44 are where we believe the price will find support over the next 30 to 60+ days. Beyond these levels, the price may continue much lower and eventually breach the sub $30 level in Q1 or Q2 of 2020, which would likely be a strong cause of the pending bear market.
(Click on image to enlarge)

Concluding Thoughts:
Any deep downside price move like this in Crude Oil would suggest that economic weakness and supply/demand issues are the root causes of a Crude Oil price collapse.
If the downside move continues as we are suggesting, many foreign nations will come under extreme economic pressures and currency levels/support could become threatened as the foundation for many oil-based economies will begin to crumble. This could create an extreme debt/credit issue for many nations throughout the planet and could push the US Dollar well above $100.The implications for extended trends and trades is incredible when you consider the scope of the economic shift that will take place if Crude Oil does begin trading below $30 in early 2020.
$30-$40 crude oil could spark or further deeping the pending bear market which has been a long time coming. Almost all the signs are showing that it’s about to start so get ready.
As a technical analyst since 1997 having lost a fortune and made fortunes from bull and bear markets I have a good understanding of how to best attack the market during its various stages. The opportunities starting to present themselves will be life-changing if handled properly.
Disclosure: If you want to know where the market is headed each day and week, well in advance then be sure to join my Pre-Market Video Forecasting service which is more


