
CoT This Week - What Funds Are Buying, Future Hints
Following futures positions of non-commercials are as of June 8, 2021.
10-year note: Currently net long 173.4k, up 118.6k.
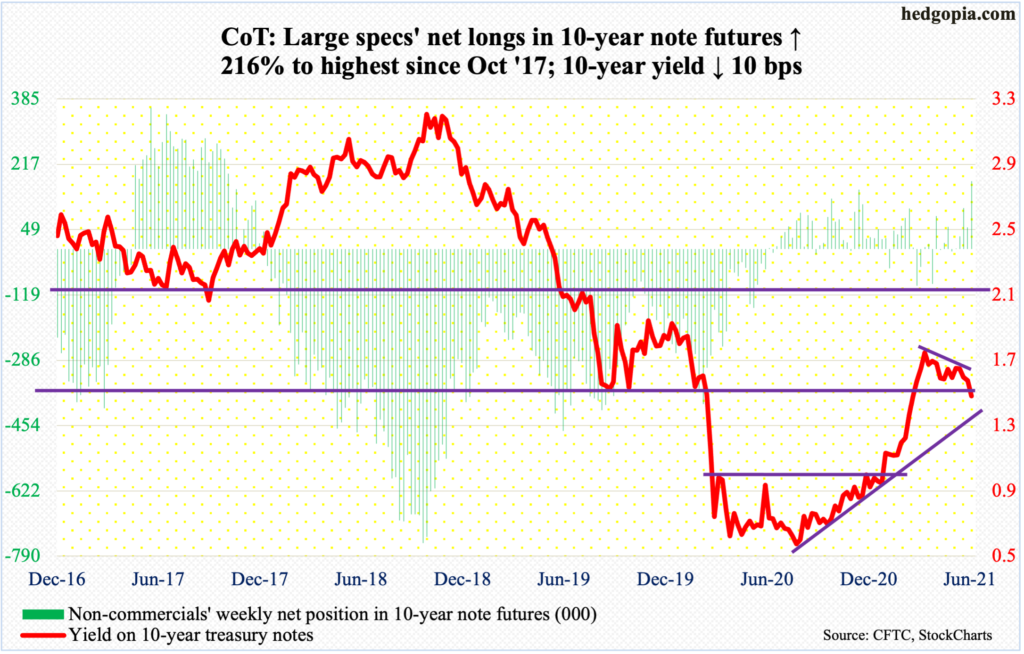
The FOMC meets next week. This is the year’s fourth scheduled meeting; four more remain. Not much is expected to occur in the benchmark rate front. The fed funds rate remains zero-bound – in a range of zero to 25 basis points; the status quo will be maintained. This is the conventional side of monetary policy.
The other side – the unconventional arm – involves its balance sheet, and the expansion thereof. In early March last year, the Fed held $4.24 trillion in assets; by Wednesday this week, this had ballooned to $7.95 trillion. Every month, the central bank has been spending up to $120 billion in purchases of treasury notes and bonds ($80 billion) and mortgage-backed securities ($40 billion).
This is where things are beginning to get a bit uncertain. Inflation is accelerating, with core CPI up 3.8 percent year-over-year in May (chart here). The official line of the Fed is that this is transitory, and its focus remains on jobs (more on this here), not on inflation.
At some point, the pace at which the Fed is accumulating assets will have to stop. The question is when, and how it will go about achieving this. We all remember the taper tantrum of 2013, when treasury yields surged after it said it would, at some future date, reduce the pace of purchases of treasury bonds.
Chair Jerome Powell and team will do their best to avoid a repeat of that. The goal is to prepare markets ahead of time, and venues like next week’s meeting can be used for that purpose. Fingers crossed!
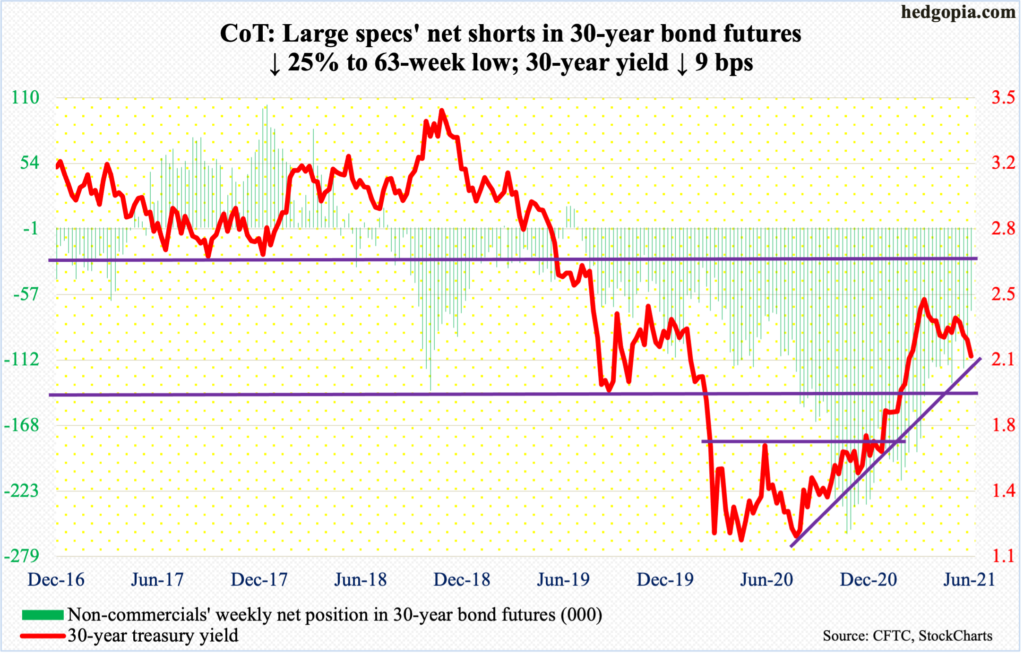
30-year bond: Currently net short 70.6k, down 23.2k.
Major economic releases for next week are as follows.
Retail sales (May), producer price index (May), industrial production (May), the NAHB Housing Market Index (June) and Treasury International Capital data (April) will be published on Tuesday.
Retail sales edged up 0.2 percent month-over-month in April to a seasonally adjusted annual rate of $619.9 billion – a record. A year ago, sales languished at $409.9 billion.
Producer prices rose 0.6 percent m/m in April, spiking 6.2 percent y/y. Core PPI increased 0.7 percent and 4.6 percent respectively over the same time period.
Capacity utilization inched up 0.6 percent m/m in April to 74.9 percent. In April last year, utilization hit the post-pandemic low of 64.2 percent.
Homebuilder optimism in May was unchanged m/m at 83. Last year, sentiment tripled from April’s 30 to November’s 90.
In the 12 months to March, foreigners purchased $406.4 billion in US equities – a record.
Housing starts (May) are due out on Wednesday. April starts declined 9.5 percent from March’s 1.73 million, which was the highest since July 2006.
WTI crude oil: Currently net long 560.5k, up 24.1k.
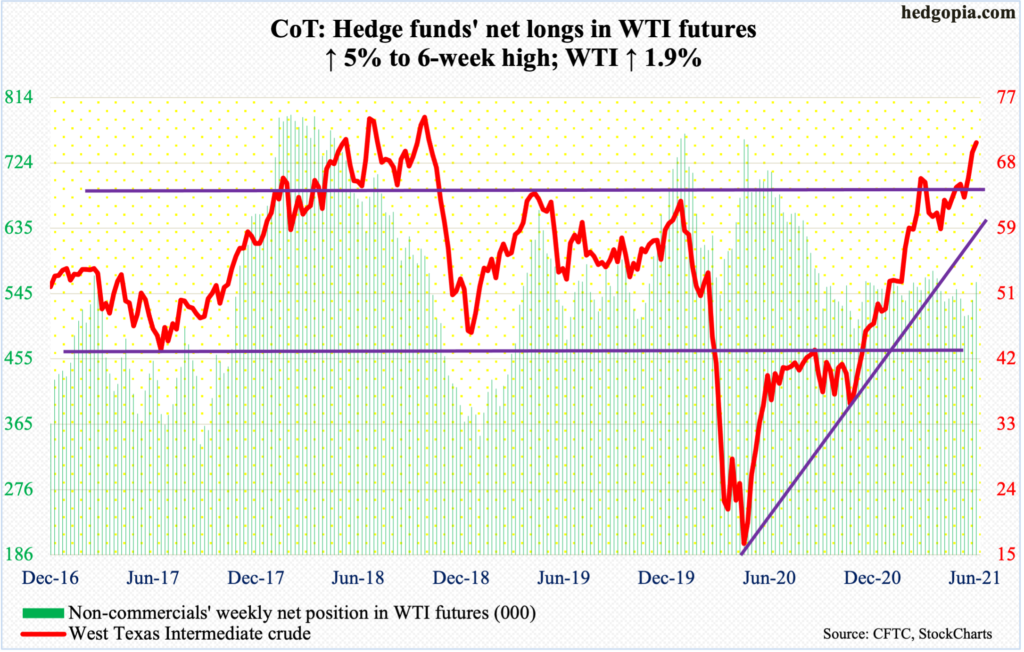
WTI ($70.91/barrel) built on last week’s breakout at $66-$67, which bulls and bears have fought over dating back to 2006. This week, the crude was up 1.9 percent, tagging $71.24 intraday Thursday.
The daily in particular is extremely overbought, but oil bulls are holding on to momentum. WTI remains comfortably above rising shorter-term averages, with the 10-day moving average providing support on Thursday.
In October 2018, the crude tagged $76.90 before pulling back substantially. This price point is a decent reference point for now. Bulls would love to go test this level. Given how overbought conditions are, a breakout retest of $66-$67 is always possible and that is when their mettle will be tested.
In the week to June 4, the EIA said, US crude production rose 200,000 barrels per day to 11 million b/d. As did crude imports, which were up one mb/d to 6.6 mb/d. Stocks of gasoline and distillates increased as well – up seven million barrels and 4.4 million barrels respectively to 241 million barrels and 137.2 million barrels. Crude stocks, on the other hand, dropped 5.2 million barrels to 474 million barrels. Refinery utilization rose 2.6 percentage points to 91.3 percent.
E-mini S&P 500: Currently net short 14.7k, down 17.4k.
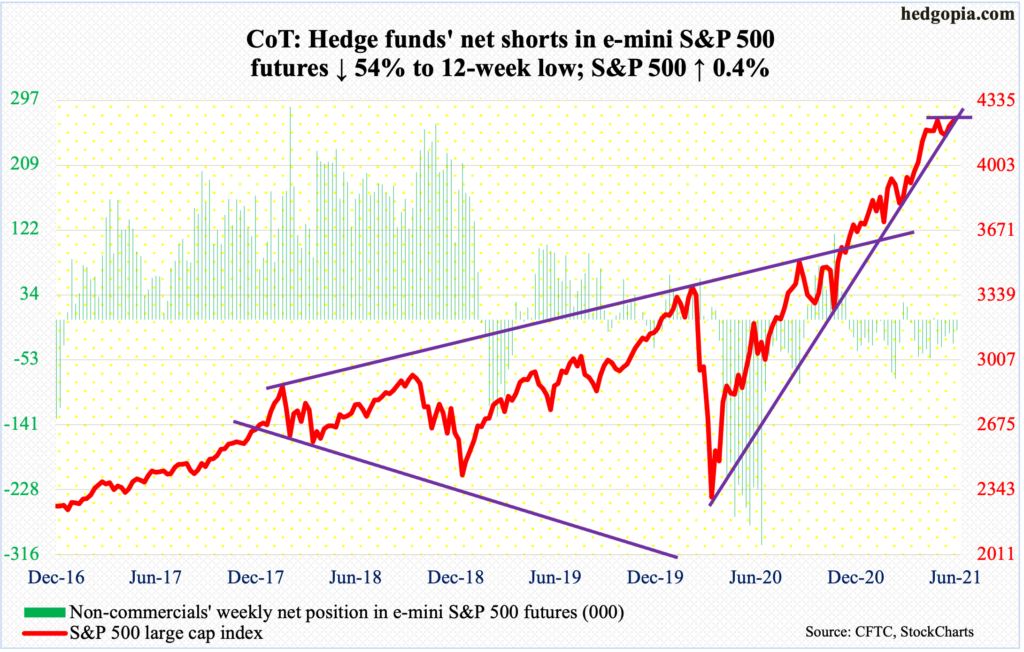
The S&P 500 (4247) half-heartedly broke to a new high. On Thursday, a new all-time high of 4250 was posted, but the large cap index is yet to decisively bust through 4230s-40s. In all probability, one is imminent.
Non-commercials reduced their net shorts to a 12-week low.
The overall action is listless, with bulls beginning to wish for softer economic data (more on this here), even as they doggedly maintain a buy-the-dip mentality. This week’s 0.4-percent rally follows last week’s weekly hanging man, which was a fourth such pattern in five weeks. Before that, a gravestone doji and a dragonfly doji appeared back-to-back. Big picture, these are potentially bearish candles, but need confirmation.
Amidst this, flows have been alternating between negative and positive. In the week to Wednesday, US-based equity funds took in $717 million, following last week’s loss of $4.6 billion (courtesy of Lipper). In the same week, $3 billion came out of SPY (SPDR S&P 500 ETF), VOO (Vanguard S&P 500 ETF) and IVV (iShares Core S&P 500 ETF); last week, the three collectively gained $1.9 billion (courtesy of ETF.com).
If weakness develops in the sessions ahead, short-term horizontal support at 4210s is the one to watch. This also lines up with the 10-day.
Euro: Currently net long 107.2k, down 2.1k.
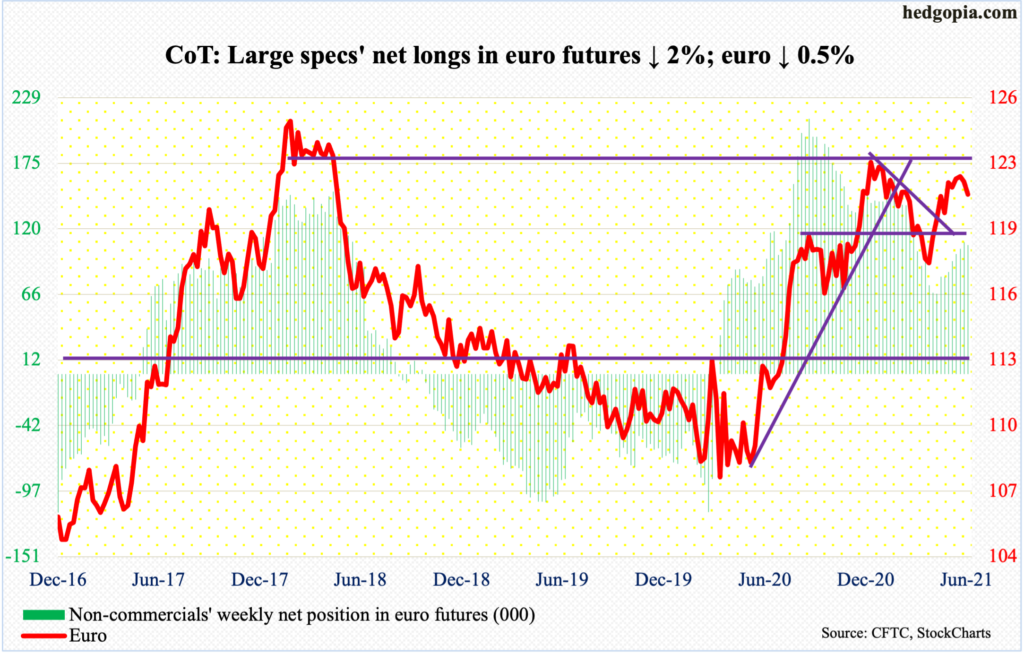
On Thursday, the euro traded in a relatively wide range between $1.2195 and $1.2143, ending the session down 0.1 percent. Traders were not sure how to react to the ECB meeting, which avoided signaling when it would begin to taper, saying it would continue to buy bonds until it judges the crisis is over.
Similar to the Fed, the ECB treats the current jump in consumer prices as transitory. In a post-meeting press conference, President Christine Lagarde said inflation is expected “to rise further in the second half of the year, before declining as temporary factors fade out.”
For now, the bank remains committed to purchasing €1.85 trillion of bonds until March 2022.
Ahead of this, the euro ($1.2108) rallied from $1.1712 on March 30 to $1.2268 on May 25, with the currency posting lower highs from that high. There is crucial horizontal support at $1.19-$1.20, which goes back 18 years. Odds favor it gets tested. The 50-day lies at $1.2081 and the 200-day at $1.1987.
Gold: Currently net long 209.4k, down 4.3k.
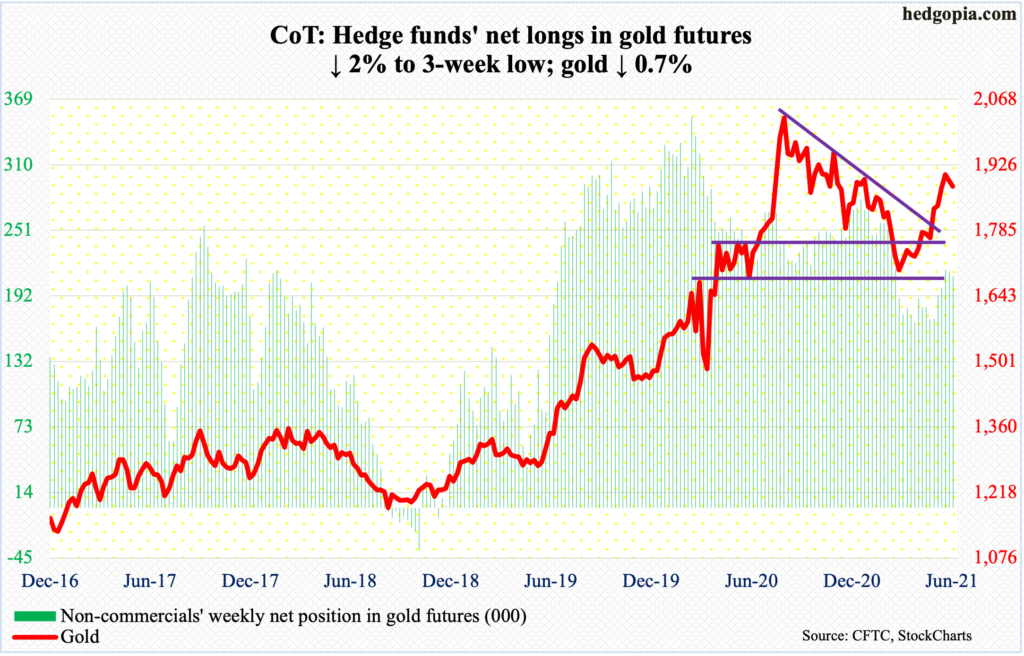
In the week to Wednesday, GLD (SPDR Gold ETF) attracted $105 million, which constitutes fourth weekly inflows out of the last five for cumulative gains of $1.4 billion (courtesy of ETF.com).
Bulls and bears continued to duke it out just under crucial resistance. In September 2011, gold peaked at $1,920s, before coming under pressure to eventually bottom at $1,045 in December 2015. Gold bugs lost this support last November.
In a spinning top session on June 1, the metal tagged $1,916 before sellers showed up. In March, gold bottomed at $1,670s, so the longs are sitting on nice gains. On Tuesday this week, the yellow metal tried to once again rally but retreated after touching $1,907.
Right here and now, a pullback is the path of least resistance. Immediately ahead, there is support at $1,870s, which is where gold ($1,880/ounce) closed out the week. Worse, the yellow metal drops to retest $1,760s-$1,770s, which it broke out of early last month.
Nasdaq 100 index (mini): Currently net short 8.5k, down 6k.
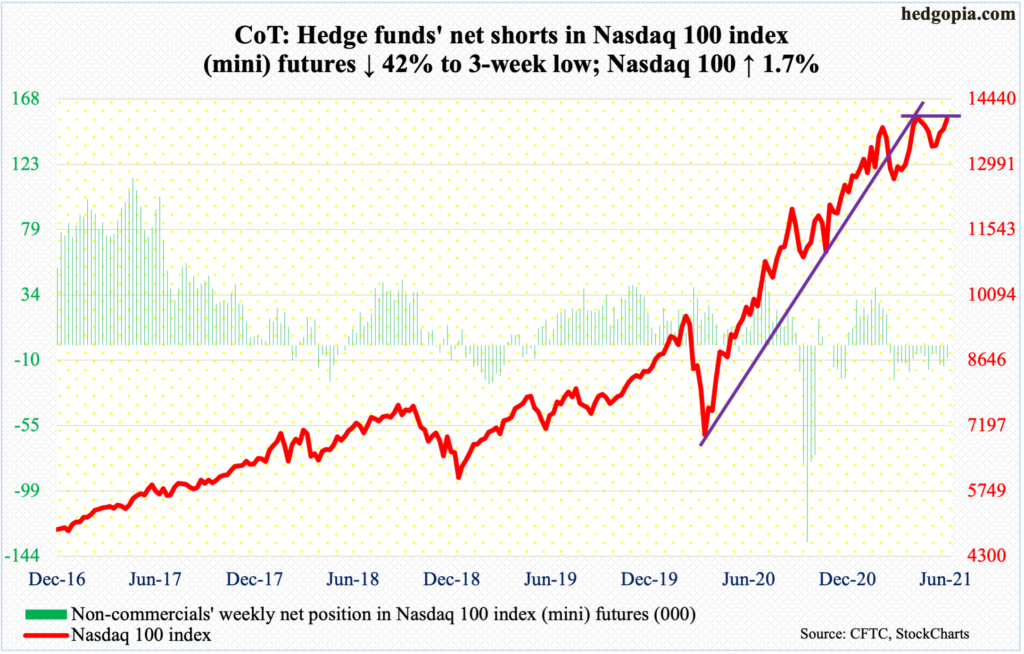
The Nasdaq 100 (13998) is getting close to a breakout. The tech-heavy index retreated after tagging 14073 on April 29 and faced difficulty in clearing 14000 for a couple of weeks before that.
Bulls deserve kudos for hanging in there despite several potentially bearish monthly candles the last several months. January produced a long-legged doji, February a dragonfly doji and March a gravestone doji; April’s 5.9-percent rally tried to neutralize these candles, but May, down 1.3 percent, formed a hanging man. June so far is up 2.3 percent and is on course for another hanging man.
There is short-term straight-line support at 13730s.
Russell 2000 mini-index: Currently net short 43.4k, up 8k.
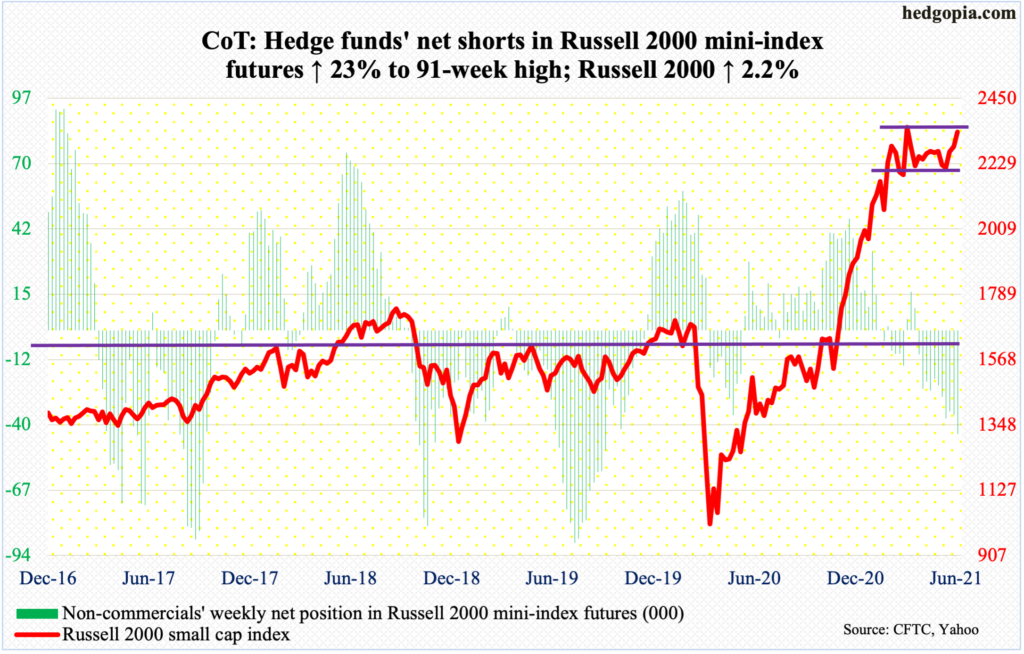
A breakout looks imminent.
The Russell 2000 (2336) on Wednesday came within less than 10 points of its all-time high of 2360 posted on March 15.
The small cap index has put up an impressive show after bottoming on May 12, trading within an ascending channel. Resistance at 2280s gave way as soon as the week began. This level is the one to watch for now – to see if small-cap bulls are determined enough to keep up the momentum.
Non-commercials are sitting on net shorts that are the highest since September 2019. They can end up aiding the longs if forced to cover.
US Dollar Index: Currently net long 1.8k, down 1.2k.
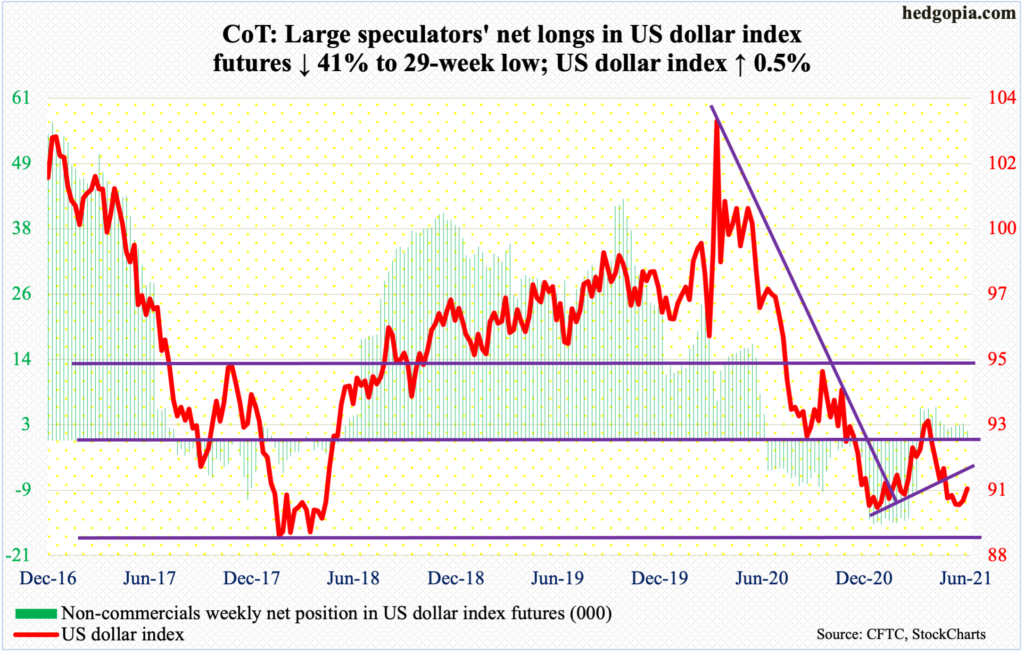
Dollar bulls defended drops below 90 all week, including Wednesday’s hammer low of 89.83.
Support at 88-89 goes back at least 17 years. On January 6, the US dollar index (90.55) dropped as low as 89.17. On May 25, a higher low of 89.52 was set. Wednesday’s low made up another higher low.
On the daily, a potentially bullish crossover between 10- and 20-day just completed. Friday’s 0.5-percent rally took care of resistance at 90.30s. The 50-day at 90.80 is the next hurdle.
VIX: Currently net short 62.1k, up 367.
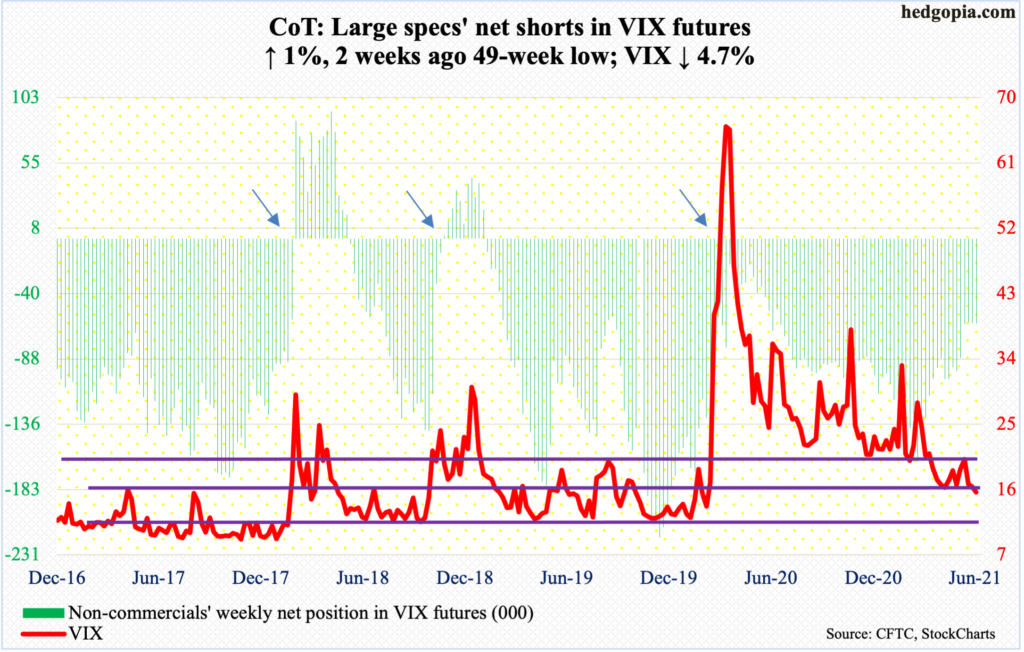
Four out of the five sessions this week saw VIX (15.65) fall below 16, with both Tuesday and Friday ticking 15.15, undercutting the prior low of 15.38 from April 14. The past couple of months, 15 has held its own. A breach exposes the volatility index to risks of low-teens.
Disclaimer: This article is not intended to be, nor shall it be construed as investment advice. Neither the information nor any opinion expressed here constitutes an offer to buy or sell any ...
more

