
CoT This Week: Hedge Fund Positions, The Future Thru Futures
Following futures positions of non-commercials are as of August 11, 2020.
10-year note: Currently net long 5.5k, down 86.6k.
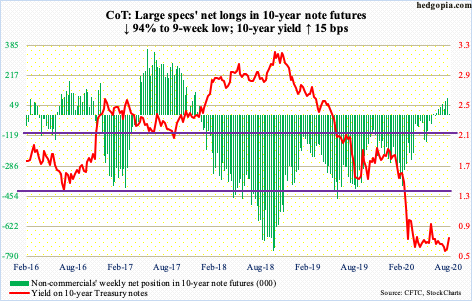
The 10-year treasury yield (0.71 percent) had a strong week, up 15 basis points, but not enough for a range breakout.
Rates have played ping pong between 0.74 percent and 0.57 percent for five months now. Wednesday, the 10-year rose as high as 0.73 percent before pulling back.
As recently as Wednesday last week, the 10-year was yielding 0.5 percent, which was a slight breach of the lower bound but bond bears (on price) quickly showed up at the daily lower Bollinger band.
Leading up to this week, non-commercials had been adding to net longs in 10-year note futures. This week, they substantially cut back. It is almost as if they expect a breakout in yields, and got out of the way.
For now, though, it is likely the status quo continues. The daily tested the upper bound this week even as several indicators reached overbought territory. If this week’s strength is real, then bond bears can step up and defend the 50-day moving average at 0.65 percent.
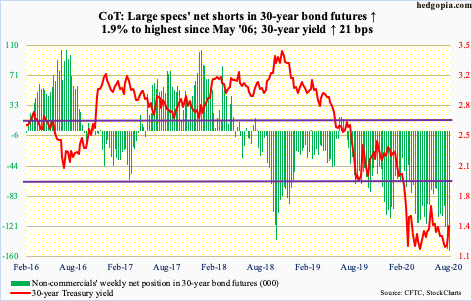
30-year bond: Currently net short 152.4k, up 2.8k.
Major economic releases next week are as follows.
The NAHB Housing Market Index (August) and Treasury International Capital data (June) come out Monday.
Homebuilder confidence shot up 14 points month-over-month in July to 72. In April, the index dropped as low as 30, which was the lowest since June 2012.
In the 12 months to May, foreigners purchased $157.3 billion in US stocks. This was a 10-year high and represents quite a turnaround in sentiment. In April last year, they sold a record $214.6 billion worth.
Housing starts (July) are due out Tuesday. In June, starts rose 17.3 percent to a seasonally adjusted annual rate of 1.19 million units. April’s 934,000 was a five-year low.
FOMC minutes (July 28-29 meeting) will be published Wednesday. The Fed made no move in that meeting.
Friday brings existing home sales (July). June sales jumped 20.7 percent m/m to 4.72 million units (SAAR). Earlier, sales dropped from February’s 5.76 million to May’s 3.91 million.
WTI crude oil: Currently net long 623.3k, down 22.1k.
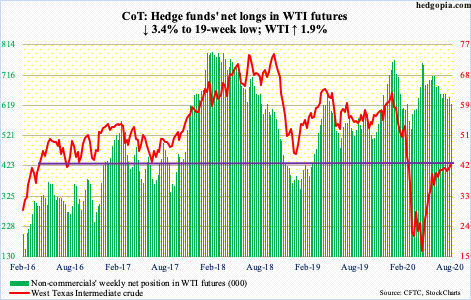
The EIA report for the week of August 7 was bull-friendly. US crude production dropped 300,000 barrels per day to 10.7 million b/d. Crude imports fell 389,000 b/d to 5.6 mb/d. Stocks of crude, gasoline and distillates all declined – down 4.5 million barrels, 722,000 barrels and 2.3 million barrels to 514.1 million barrels, 247.1 million barrels and 177.7 million barrels, in that order. Refinery utilization rose 1.4 percentage points to 81 percent.
Wednesday, the day the report came out, WTI ($42.01/barrel) rallied 2.6 percent. For several sessions now, rally attempts have been bound by the slightly declining 200-day ($42.54). The 50-day at $40.25 is right underneath. The 10- and 20-day are converging. Plus, daily Bollinger bands have narrowed, with the upper band slightly rising the past few sessions. Should the 200-day give way, bulls will be eyeing $48-49. A loss of the 50-day opens the door to a test of $34-35.
E-mini S&P 500: Currently net short 65.9k, up 21.1k.
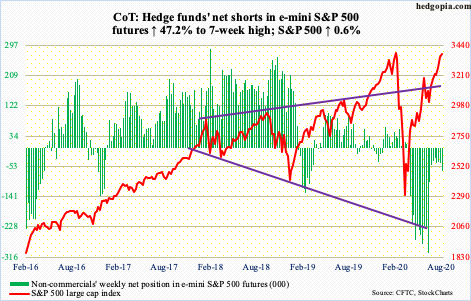
US-based equity funds took in $5.7 billion in the week to Wednesday (courtesy of Lipper). This was the first positive week in three and second in nine; in the week to July 22, a rather paltry $746 million came in. After losing $2.8 billion in the prior couple of weeks, SPY (SPDR S&P 500 ETF), VOO (Vanguard S&P 500 ETF) and IVV (iShares Core S&P 500 ETF) collectively gained $2 billion in the week to Wednesday (courtesy of ETF.com).
Bulls hope this continues. Wednesday’s intraday high of 3387.89 was merely 5.64 points from posting a new high. Earlier, the week started with a hanging man, followed by an outside day Tuesday. Although the S&P 500 (3372.85) rallied 1.4 percent Wednesday, Thursday’s doji was another session highlighting indecision between bulls and bears. This was followed by another doji Friday.
The important thing is, there is no sign of a V-shaped recovery in the economy. The index, on the other hand, has for sure carved out a sharp V. After the February peak, it dropped to 2191.86 on March 23, before rallying to recover all of the loss.
Short squeeze helped. In the four months through the end of July, SPY short interest dropped from 238.2 million to 165 million, which is a five-month low. Potential fuel for squeeze is increasingly running dry.
Euro: Currently net long 199.8k, up 19.1k.
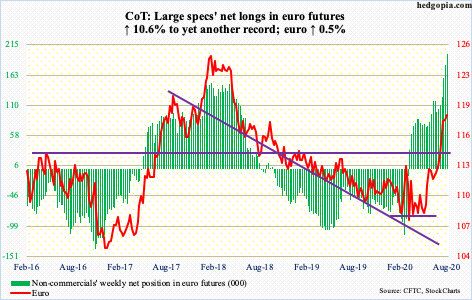
After the euro ($1.1843) tagged $1.1906 last Wednesday to run into 17-year-plus resistance at $1.19-1.20, it came under pressure to lose the 10-day (more on this here). By Tuesday, the currency was down to $1.1725 – just above short-term support at $1.17, and that was bought. Thursday, the 10-day, which is now flattish, was recaptured. The Tuesday low also tested the falling trend line from April 2008 which the euro broke out of three weeks ago.
Momentum lies with euro bulls as long as the 10- and 20-day are intact, but breach risks are rising. Sentiment – at least measured by non-commercials’ holdings – skews heavily bullish; net longs rose to yet another high.
Gold: Currently net long 224.1k, up 14.7k.
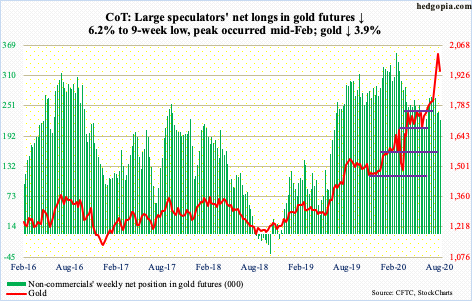
For the first time in nine weeks, GLD (SPDR Gold ETF) suffered outflows. In the week through Wednesday, $1.1 billion left the ETF. In contrast, $339 million moved into IAU (iShares Gold Trust) – its 21st positive weekly flows (courtesy of ETF.com).
Last Friday, in a session in which gold ($1,949.80/ounce) posted a new intraday high of $2,089.20, it suffered an outside day reversal. This was followed by a 4.6-percent decline this Tuesday. Intraday Wednesday, gold was down another 3.7 percent, but the low of $1,874.20 was bought, pushing the price back above the September 2011 high of $1,923.70.
Gold remains extended on several timeframes. At a glance, the metal this week successfully retested $1,920s breakout, but it took place in such a hurried fashion the overbought condition the metal is in has hardly been unwound.
Nasdaq 100 index (mini): Currently net long 12.5k, down 5.8k.
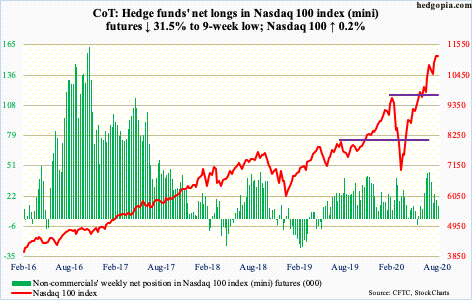
Once again, tech bulls were not in a mood to let go of the 20-day. The Nasdaq 100 (11164.45) came under pressure for three sessions after rising to a new intraday high of 11282.24 last Thursday. Tuesday’s low of 10855.06 stopped right at the 20-day. In the next session, the 10-day was recaptured; ditto with five-week horizontal support-turned-resistance at 11000. For now, that price level, and the two averages, are the ones to watch.
Tech led for a while but has looked vulnerable in recent trading. Of note, QQQ (Invesco QQQ Trust) short interest, which had built up to 68.5 million by mid-March, is now down to 48.3 million at the end of July – an eight-and-a-half-month low (chart here). Short squeeze provided a major tailwind to the ETF post-March low. That fuel is running low.
Russell 2000 mini-index: Currently net long 15.2k, up 7.5k.
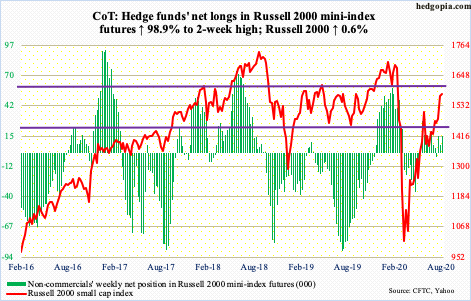
Going back to January 2018, bulls and bears have been involved in a tug of war just north of 1600 – not once, not twice, but several times. This level was last lost in the February selloff. After that selling stopped on March 18 at 966.22, the Russell 2000 gradually rose, past one after another resistance. Most recently, 1450s-60s fell last month.
After hugging that price range for more than two weeks, the Russell 2000 (1577.88) began to pull away as soon as August began. Tuesday, bulls really went after 1600-plus, tagging 1603.60 intraday but only to reverse and end the session at 1575.10 (more on this here).
In July, IWM (iShares Russell 2000 ETF) short interest dropped 23.7 percent, but at 94.6 million it remains elevated. A decisive 1600-plus breakout has the potential to cause major squeeze, but this resistance is not likely to give way that easy.
US Dollar Index: Currently net short 8.2k, up 1.7k.
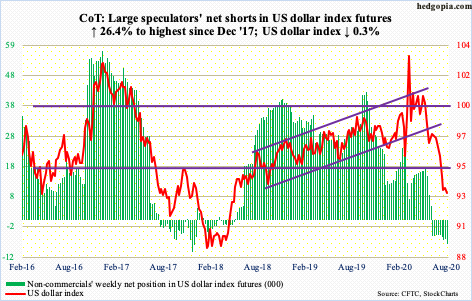
The US dollar index (93.11) fell 0.3 percent this week, with a high of 93.92 and a low of 92.93. The sideways action followed a long-legged doji last week and a hammer the week before. Previously, it dropped from a high of 103.96 on March 23 to 92.50 last Thursday. The drop pushed several indicators into oversold territory.
Three weeks ago, a rising trend line from May 2011, when the index bottomed at 72.70, was breached, albeit slightly. From dollar bulls’ perspective, the good thing is that support just north of 92, which goes back at least 17 years, is intact. What they don’t want to see happen is bears beginning to defend the underside of that broken trend line. Otherwise, odds of a rally are growing. For now, 93.90s is the one to watch, which approximates the 20-day at 93.75.
VIX: Currently net short 93.9k, up 6.4k.
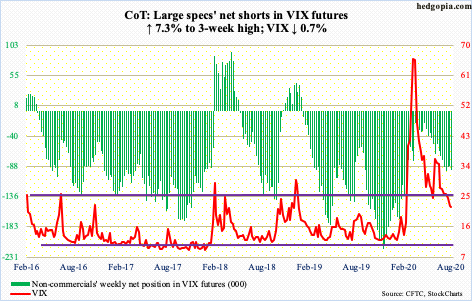
Tuesday, VIX (22.05) proceeded to undercut last week’s low of 20.97 by dropping to 20.28 intraday but not before reversing higher to end the session at 24.03. The 10- and 20-day are beginning to converge, with 1.03 separating the two. The daily Bollinger bands similarly are narrowing, to a point when just a tad above five points separate the two. Above, the 50- and 200-day are about to converge as well (respectively 27.94 and 27.46).
Volatility is compressed. Like a coiled-up spring or a stretched rubber band, unwinding will release a ton of energy – just a matter of time.


