
CoT This Week: Futures, Hedge Fund Positions
Following futures positions of non-commercials are as of April 9, 2019.
10-year note: Currently net short 261.6k, up 37.3k.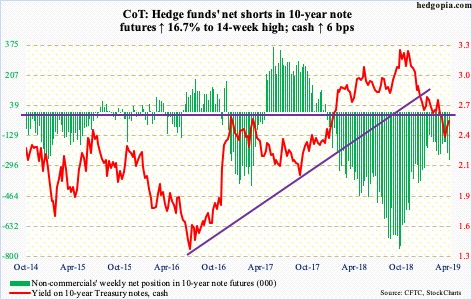
During the week, job openings painted a mixed picture. Non-farm job openings (JOLTS) for February dropped 538,000 month-over-month to 7.1 million. Last November’s 7.6 million was the highest ever. NFIB job openings for March, however, matched last December’s record high 39. It is premature to conclude but it is possible jobs data is beginning to straddle the line. In February, the economy created 33,000 non-farm jobs. A mini-panic set in. March, however, snapped back with 196,000, for a three-month average of 180,000.
Healthy job creation has been the impressive aspect of what otherwise has been a sub-par expansion post-Great Recession. Weakness here will be the last straw. If this scenario unfolds, it is just a matter of time before the 10-year Treasury yield (2.56 percent) will gravitate toward two percent. Mid-March, it lost 2.62 percent – a crucial level going back a decade. This resistance is the path of least resistance near term. Perhaps anticipating this, non-commercials once again have been adding to net shorts, currently at a 14-week high. Last September, these traders held record shorts, which as they gradually got unwound put downward pressure on the 10-year rate.
30-year bond: Currently net short 25.3k, up 6.4k.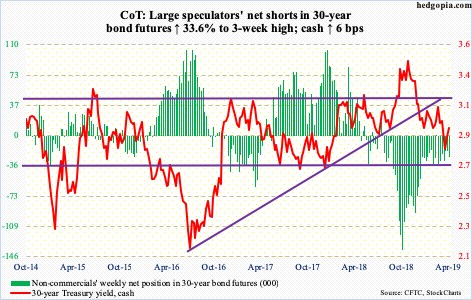
Major economic releases next week are as follows.
On Tuesday, industrial production (March) and the NAHB housing market index (April) come out.
In February, US capacity utilization rose 1.3 percent year-over-year to 78.2 percent. Last November’s 78.8 percent was the highest since January 2015.
Builder sentiment in March was flat with February’s 62. Sentiment dropped from 74 in December 2017, which was the highest since July 1999, to last December’s 56, before rebounding a tad.
February’s trade deficit is on tap for Wednesday. The US deficit in January was $51.1 billion, with a 12-month total of $3.13 trillion.
March’s retail sales are due out Thursday. February sales were up 2.2 percent y/y to a seasonally adjusted annual rate of $506 billion. Last October’s $511.6 billion was the highest ever.
Friday brings housing starts for March. Starts dropped 8.7 percent m/m in February to 1.16 million units (SAAR). The cycle high 1.33 million units was reached in January 2018.
Crude oil: Currently net long 618.4k, up 44.8k.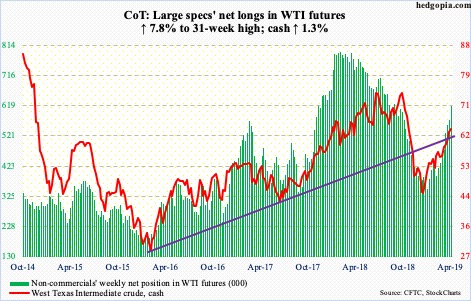
In March, OPEC’s oil production fell by 534,000 barrels per day to 30.02 million bpd – a four-year low. Saudi Arabia’s dropped by 324,000 bpd to 9.8 mbpd. As recently as last November, that nation pumped a record 11.1 mbpd. At the same time, the IEA, while saying the oil market is tightening, warned that risks to oil demand are currently to the downside because of economic threats. The message is mixed.
In the meantime, US crude production in the week to April 5 remained unchanged at 12.2 mbpd – a record. Crude stocks rose seven million barrels to 456.6 million barrels, which was the highest since November 2017. Stocks of gasoline and distillates, on the other hand, fell – by 7.7 million barrels and 116,000 barrels to 229.1 million barrels and 128.1 million barrels, respectively. Crude imports, too, dropped by 164,000 bpd to 6.6 mbpd. Refinery utilization rose 1.1 percentage points to 87.5 percent.
The cash ($63.89/barrel) this week tried to cleanly break through the underside of a trend line from February 2016 when it bottomed at $26.05 but was soon met with minor selling. From late December through Tuesday’s high of $64.79, the crude jumped 53 percent. Daily and weekly momentum indicators are stretched. There was a little bit of a wick on last week’s weekly candle. The 200-day moving average lies at $61.59.
E-mini S&P 500: Currently net short 3.1k, down 14.5k.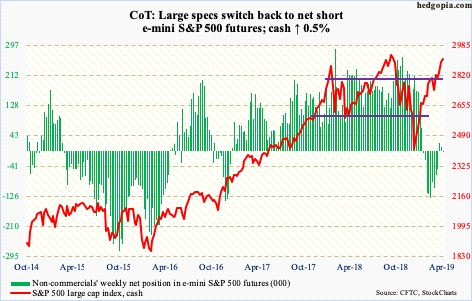
In the week through Wednesday, SPY (SPDR S&P 500 ETF), VOO (Vanguard S&P 500 ETF) and IVV (iShares core S&P 500 ETF) gained a combined $4.5 billion. This followed inflows of $4.3 billion in the prior week (courtesy of ETF.com).
It seems like the 50/200 golden cross which completed on the cash (2907.41) on April 1 has enticed buyers. Since the day that pattern completed, the three ETFs above pulled in $7 billion. In the week to Wednesday this week, US-based equity funds attracted $4.3 billion. This, after losing $3.9 billion in the prior week (courtesy of Lipper).
Having already rallied the S&P 500 23 percent from late-December lows, bulls need every help they need. The index is merely 1.2 percent from last September’s all-time high. The 1Q earnings season that just got underway can play a role in this regard. Over the past several months, the sell-side has drastically lowered estimates, so the bar is low. At the same time, stocks have rallied massively into this, pushing up multiples (more on this here).
Euro: Currently net short 102.2k, up 3k.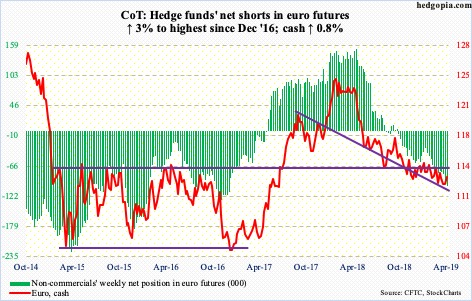
As expected, the ECB this week reiterated its plans to keep key interest rates at current levels at least through the end of the year. It also sounded downbeat on the eurozone’s economic outlook.
The cash ($113.10), already near the bottom of a five-month range, was indifferent. It has tried to rally since bottoming at $111.84 on April 2. It closed Friday right at the 50-day; $113 also holds horizontal resistance. Shorter-term moving averages are beginning to turn up. As long as $112 is not lost, euro bulls have a reason to be optimistic.
Gold: Currently net long 105.4k, up 10.8k.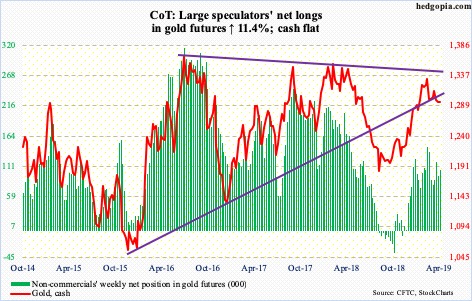
GLD (SPDR gold ETF) lost another $256 million in the week ended Wednesday, although IAU (iShares gold trust) took in $34 million (courtesy of ETF.com). GLD’s loss followed outflows of $831 million in the prior week.
Gold bugs probably got excited Wednesday when the cash ($1,295.20/ounce) rallied slightly past trend-line resistance from February 20 as well as the 50-day ($1,308.65) but that proved fleeting. Thursday, it fell 1.6 percent. The weekly is in the midst of unwinding its overbought condition. Support at $1,280s has once again gained in importance. This is a line in the sand for the moment.
Nasdaq 100 index (mini): Currently net long 7.4k, up 253.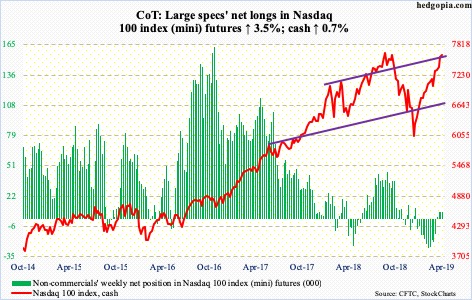
In the week to Wednesday, QQQ (Invesco QQQ trust) took in $1.5 billion (courtesy of ETF.com). This was more than the $1 billion it had lost in four of the prior five weeks. More such inflows are needed should the cash (7628.15) rally to a new high. It is merely 0.9 percent from the all-time high of 7700.56 from October last year. In all likelihood, a new high is just a matter of time.
That said, non-commercials are not aggressively betting on this outcome, with net longs flat in the 7k range the past three weeks. Just in case weakness occurs, around 7500 lies trend-line support from last December, followed by 7200. The latter is important. The 50-day (7227.66) lies there as well.
Russell 2000 mini-index: Currently net short 10.4k, up 1.1k.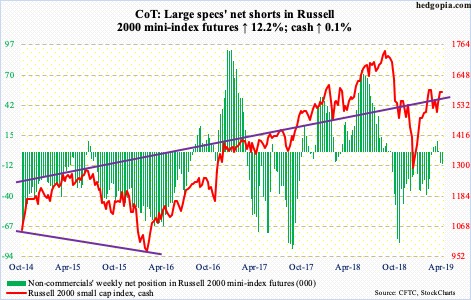
Last week, the cash (1584.80) broke through a descending channel formed after it was rejected on February 25 just north of 1600; it soon proceeded to retake the 200-day (1571.80). This likely helped flows. In the week to Wednesday, IJR (iShares core S&P small-cap ETF) attracted $243 million and IWM (iShares Russell 2000 ETF) $378 million (courtesy of ETF.com).
But building on that mini-breakout has proven difficult. This week, the Russell 2000 inched up 0.1 percent. Bulls are yet to test 1600, which goes back to January last year. This is where the neckline of an inverse head and shoulders lies. Bulls salivate over this prospect, but small-caps do not quite act like this pattern is on the way to getting completed. Of late, the Russell 2000 has lagged its US peers. Until last week, the index was the only major equity index not to have retaken the 200-day. This sentiment is reflected in non-commercials’ positioning; they have once again switched to net short.
US Dollar Index: Currently net long 29.4k, up 598.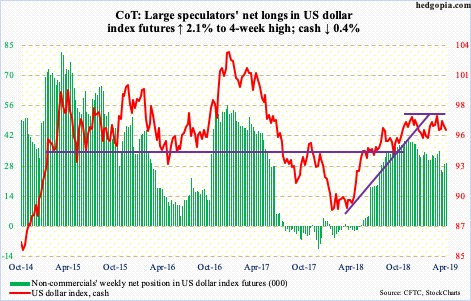
For the past few weeks, dollar bulls and bears fought over control of a rising trend line from the lows of one year ago. The cash (96.07) bottomed just north of 88 back then. That trend-line is now lost, albeit only slightly. There is another trend-line support around 95.60s from last September. Loss of this can tilt the balance in favor of bears – at least near term.
VIX: Currently net short 164.4k, up 22.9k.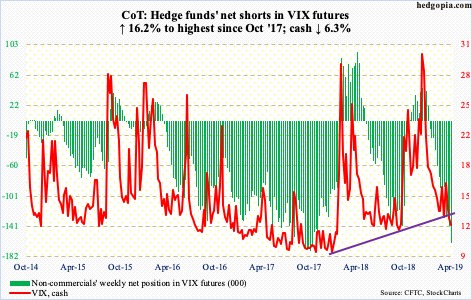
Non-commercials continue to push. They are now merely 10.3k contracts from record net shorts of October 2017. Holdings have now surpassed last October’s levels, right before a surge in the cash (12.01). Concurrently, the contango in the VXST-VIX-VXV-VXMT curve this week went deeper into the negative territory, with a spread of minus 6.3. Sooner or later, these metrics get unwound. It is just a matter of when – and whether or not VIX continues lower before unwinding begins.
Volatility bulls can take solace in the fact that VIX has not closed sub-12 since last September. In the past, sustained rallies in stocks routinely pushed the volatility index toward 10-11. Its all-time low of 8.56 was recorded in November 2017 – around the time non-commercials had built up record net shorts in VIX futures. This time around, VIX is holding up better. That said, 12 needs to hold.


