
CoT This Week: Futures And What Hedge Funds Are Buying
Following futures positions of non-commercials are as of May 4, 2021.
10-year note: Currently net short 7.2k, up 63k.
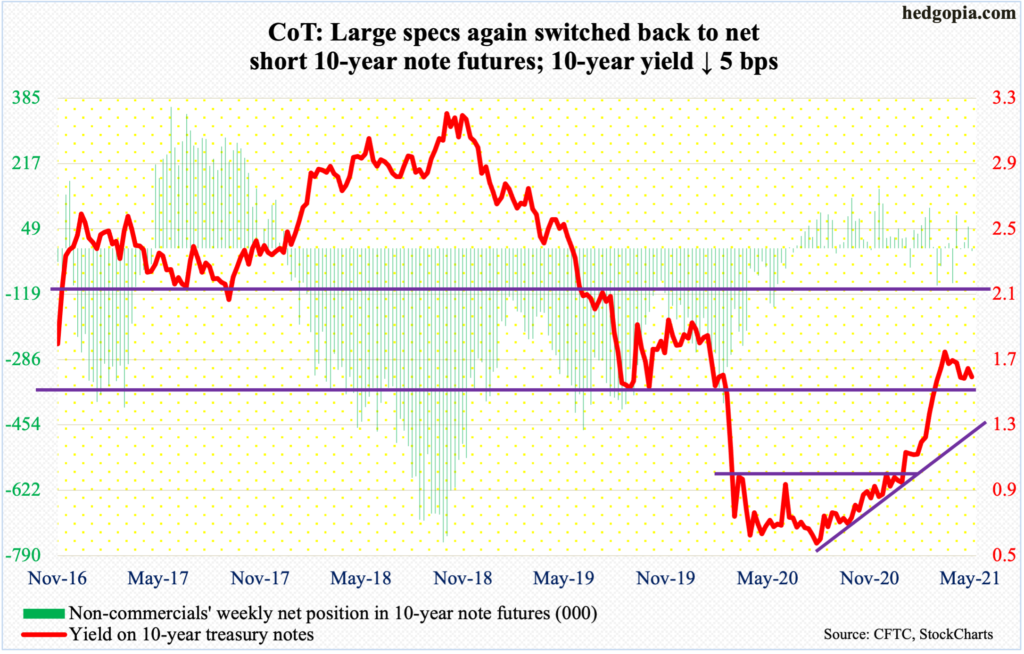
Treasury Secretary Janet Yellen stated on Tuesday that “it may be that interest rates will have to rise somewhat to make sure that our economy doesn’t overheat.” Equities sold off in that session, tech in particular. But they soon regained their footing. By Friday, the S&P 500 rallied to a new high.
Speaking at a different event later Tuesday, Yellen walked back her comments, saying any price increases would be transitory, which is the line used by the Fed. Besides, even on Tuesday, the bond market pretty much yawned. The 10-year treasury yield fell two basis points to 1.59 percent and closed the week at 1.57 percent, down five basis points for the week.
More importantly, two-year yields were unchanged at 0.16 percent on Tuesday, ending the week at 0.15 percent. This section of the yield curve tends to be the most sensitive to interest rate policy, and the Fed tends to pay close attention to the message thereof.
Until then, the ongoing accommodative monetary policy in all probability continues – using both conventional (fed funds rate) and unconventional (balance sheet expansion) tools. As things stand, the Fed is focused on the labor market and not so much on inflation.
It is a different discussion altogether if by doing so the central bank is painting itself into a corner, which is what Yellen seems to be suggesting (more on this here).
30-year bond: Currently net short 131.8k, up 15.2k.

Major economic releases for next week are as follows.
On Tuesday, the NFIB Optimism Index (April) and JOLTS (March) will be published.
Small-business job openings in March rose two points month-over-month to 42 – a new high.
Non-farm job openings jumped 268,000 m/m to 7.38 million in February. The record high 7.57 million was scored in November 2018.
The consumer price index (April) is due out on Wednesday. In March, consumer prices rose 0.6 percent m/m and 2.62 percent year-over-year. On a core basis, prices respectively increased 0.3 percent and 1.65 percent.
Thursday brings the producer price index (April). March’s producer prices rose one percent m/m and 4.2 percent in the 12 months to March. Core PPI increased 0.6 percent and 3.1 percent, in that order.
Retail sales (April), industrial production (April) and the University of Michigan’s consumer sentiment index (May, preliminary) are scheduled for Friday.
Retail sales in March surged 9.8 percent m/m and 27.7 percent y/y to a seasonally adjusted annual rate of $619.1 billion – a new record.
Capacity utilization rose 1.1 percent y/y in March to 74.4 percent. This was the first y/y rise in two years.
Consumer sentiment jumped 3.4 points m/m in April to 88.3 – a 13-month high.
WTI crude oil: Currently net long 551.2k, up 10.2k.
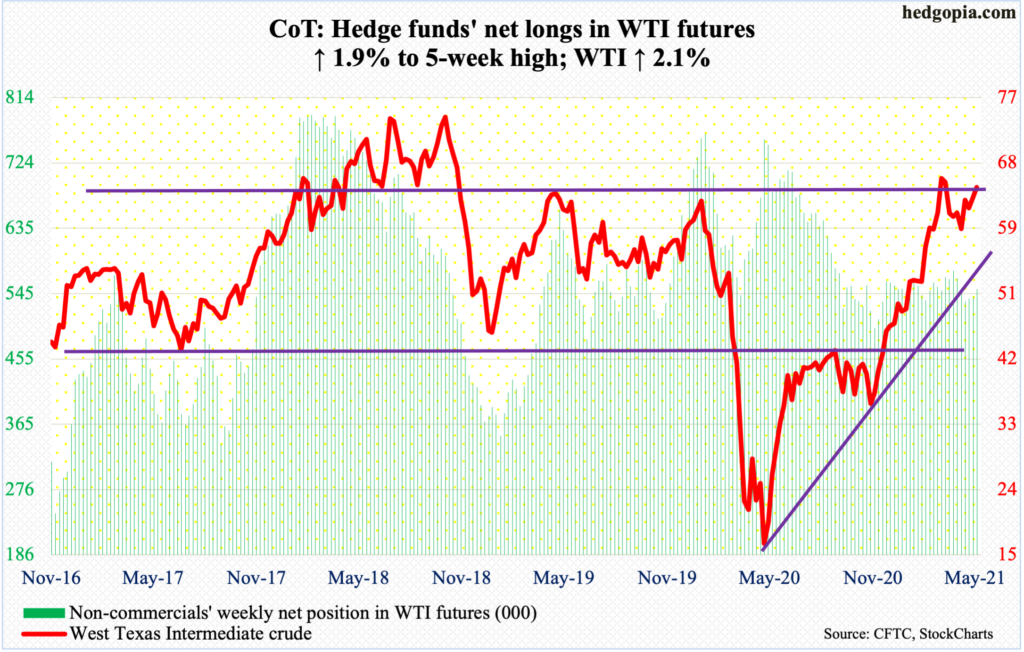
On Wednesday, WTI ($64.90/barrel) ticked $66.76 intraday to come within 1.8 percent of March 8 high of $67.98 but only to reverse lower just outside the daily Bollinger band. It nonetheless finished up 2.1 percent for the week.
The crude has made higher lows since bottoming at $57.25 on March 23. Bulls now have decent support at $58, but also face decent resistance between $66 and $67. A breakout will be significant, should one transpire.
In the meantime, US crude production in the week to April 30 was unchanged at 10.9 million barrels per day. Crude imports dropped 1.2 mb/d to 5.5 mb/d. As did stocks of both crude and distillates, which respectively declined eight million barrels and 2.9 million barrels to 485.1 million barrels and 136.2 million barrels. Gasoline stocks, however, rose 737,000 barrels to 235.8 million barrels. Refinery utilization increased 1.1 percentage points to 86.5 percent.
E-mini S&P 500: Currently net short 33.8k, up 36.1k.
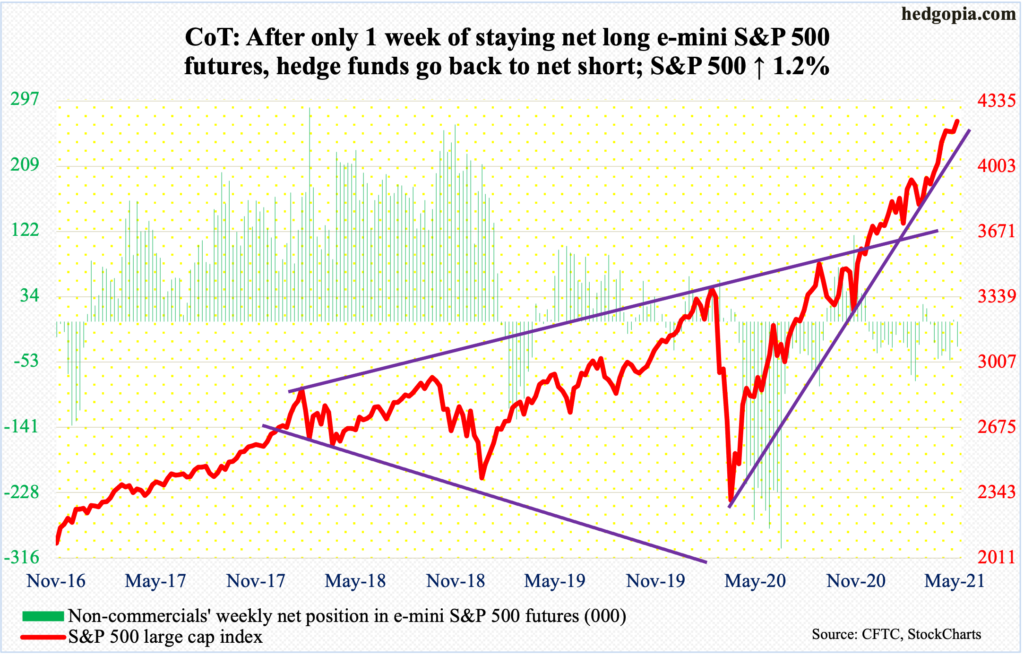
The day Yellen spoke (see above), the S&P 500 dropped 0.7 percent and was down 1.5 percent at the session lows. Bulls soon regained their footing. On Thursday, the large cap index (4232.6) rallied 0.8 percent and added another 0.7 percent on Friday to a new high – past the prior all-time high of 4218.78 set on April 29.
Flows were in cooperation. In the week to Wednesday, US-based equity funds attracted $4.8 billion. In the last 13, flows have been positive in 12, for cumulative inflows of $109.3 billion (courtesy of Lipper). In the week to Wednesday, SPY (SPDR S&P 500 ETF), VOO (Vanguard S&P 500 ETF) and IVV (iShares Core S&P 500 ETF) also took in $5.2 billion (courtesy of ETF.com).
Amidst this, the behavior of the weekly is worth mentioning. This week formed a hanging man. This follows a gravestone doji last week and a dragonfly doji the week before. These are candles that can potentially turn bearish but need confirmation.
Euro: Currently net long 84.8k, up 3.9k.
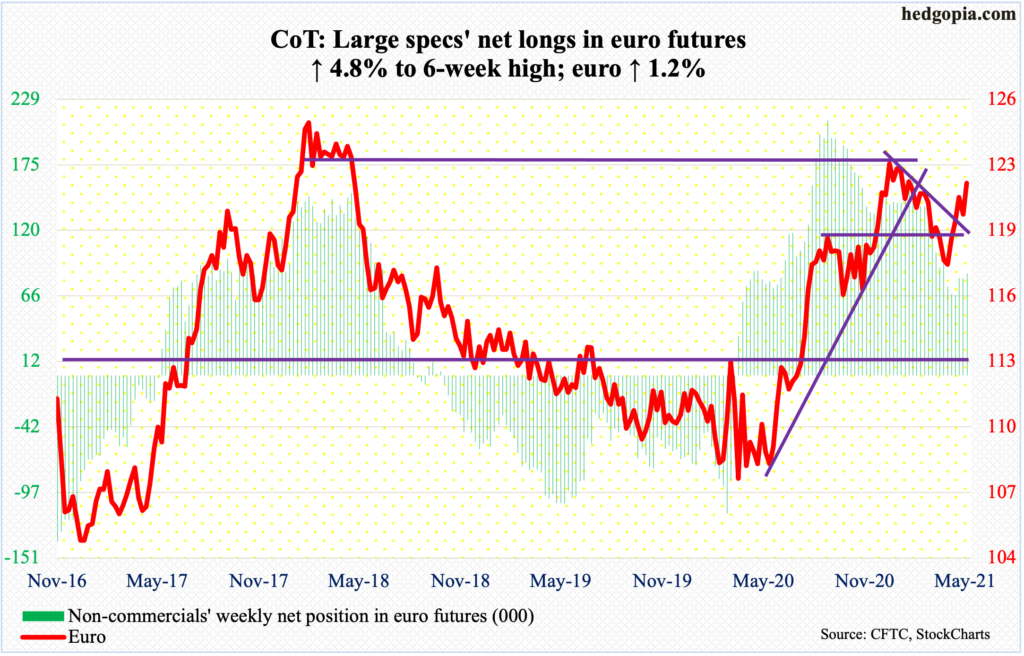
Support at $1.19-$1.20 was tested this week – successfully. This level goes back 18 years. After making a weekly low of $1.1990 on Wednesday, the euro ($1.2164) gapped up 0.5 percent on Thursday to test its 10-day and another 0.9 percent on Friday to break out of a falling trend line from January 6 when it tagged $1.2345.
The currency faces resistance just under $1.22.
Gold: Currently net long 170.7k, up 122.
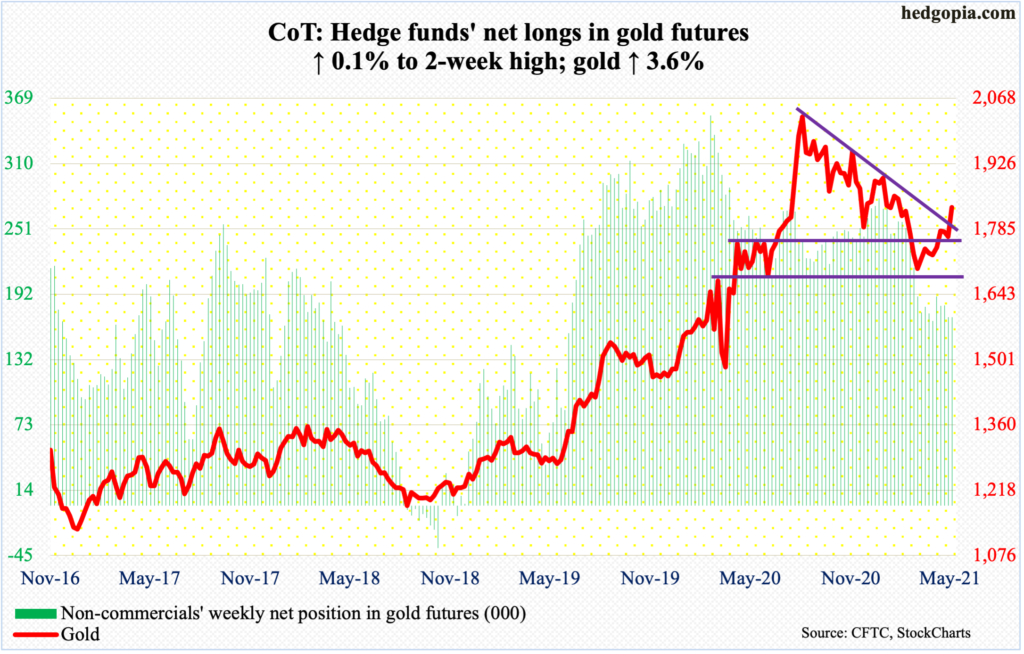
After defending $1,760s-$1,770s in the first three sessions, gold bugs rallied the metal 1.8 percent on Thursday to recapture a falling trend line from August 7 last year when gold ($1,831.30/ounce) peaked at $2,089.20. On Friday, it added another 0.9 percent.
Bulls hope this will help create positive vibes. Non-commercials, having cut back their once-massive net longs, are yet to get aggressive.
And, at least until the week to Wednesday, gold-focused ETFs were bleeding, with IAU (iShares Gold Trust) losing $35 million and GLD (SPDR Gold ETF) $115 million (courtesy of ETF.com).
GLD in particular began to bleed after seeing no activity for seven sessions through April 28. This followed cumulative loss of $14.7 billion over 24 of 27 weeks (courtesy of ETF.com), generating hope that the worst was over. But withdrawals continued in the latest week. For gold bugs, the consolation is that this took place before Thursday’s breakout, which, they hope, will attract new money.
Immediately ahead, there is support at $1,800.
Nasdaq 100 index (mini): Currently net short 16.8k, up 9k.
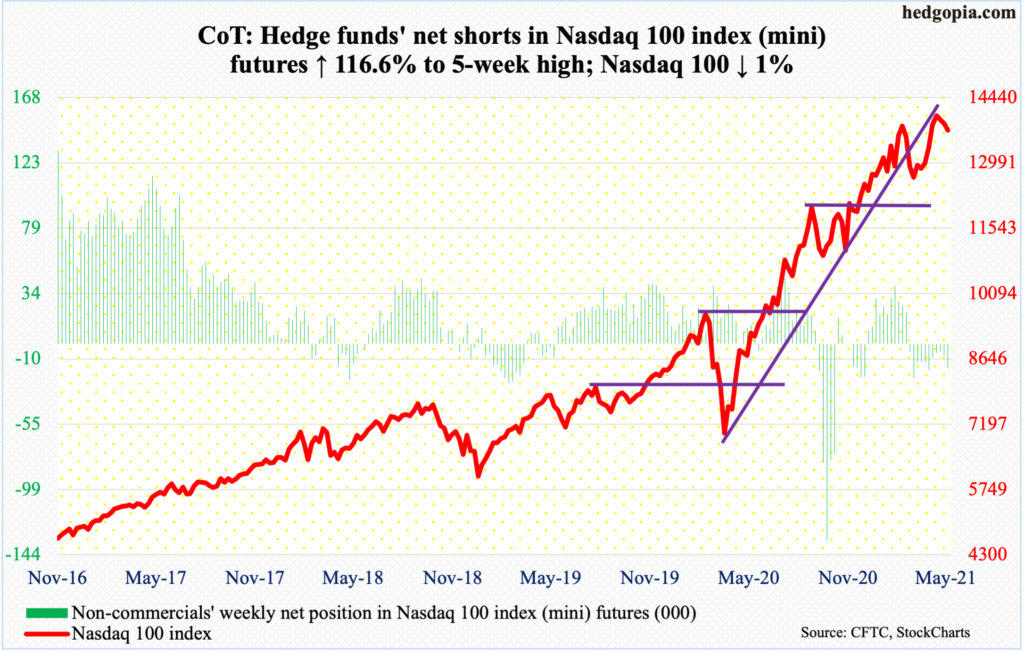
Yellen’s comments did not sit well with tech investors. On Tuesday, the Nasdaq 100 was down 1.8 percent and was down as much as 2.9 percent at the session lows.
The prevailing perception is that a rising rate environment is not good for tech stocks (more on this here). The Nasdaq 100 did post a new intraday high of 14073.48 on April 29, but the tech-heavy index has not made much headway since February 16 when it top-ticked 13879.77. In the subsequent selling, it lost a rising trend line from the low of March last year; the underside of that trend line is resisting rally attempts.
On Tuesday, the index (13719.63) suffered a mini breakdown of sorts, gapping down, although bulls stepped up to defend a confluence of support. Tuesday’s intraday low of 13396.11 defended four-month horizontal support and two-month rising trend line. Plus, the 50-day moving average lies at 13365.48. On Thursday, that low was defended again.
Bulls may have something to work with here. On Friday, they filled Tuesday’s gap at 13800 but at the same time were unable to hang on to the gains, finishing with a long-legged doji.
Russell 2000 mini-index: Currently net short 23.1k, up 2.9k.
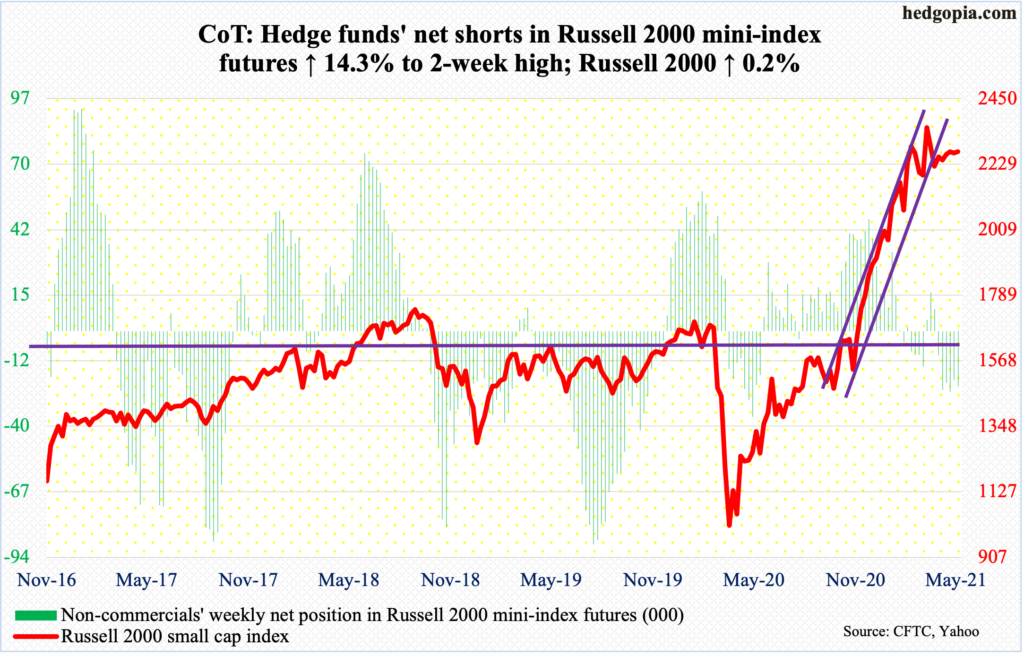
The right shoulder of a potential head-and-shoulders formation took more concrete shape this week. It is a potentially bearish pattern and will complete once the Russell 2000 (2271.63) breaks the neckline at 2070s-2080s.
Having rallied 144 percent from the low of March last year through the March 15 record high of 2360.17 this year, the small cap index has lost its mojo. It already lost an ascending channel from last October-November.
Before 2070s-2080s is tested, a rising trend line from late last year will be tested at 2170s. On Thursday, the index did drop to 2205.59, before rallying 1.4 percent on Friday to finish right under horizontal resistance at 2280s.
US Dollar Index: Currently net long 2.1k, down 691.
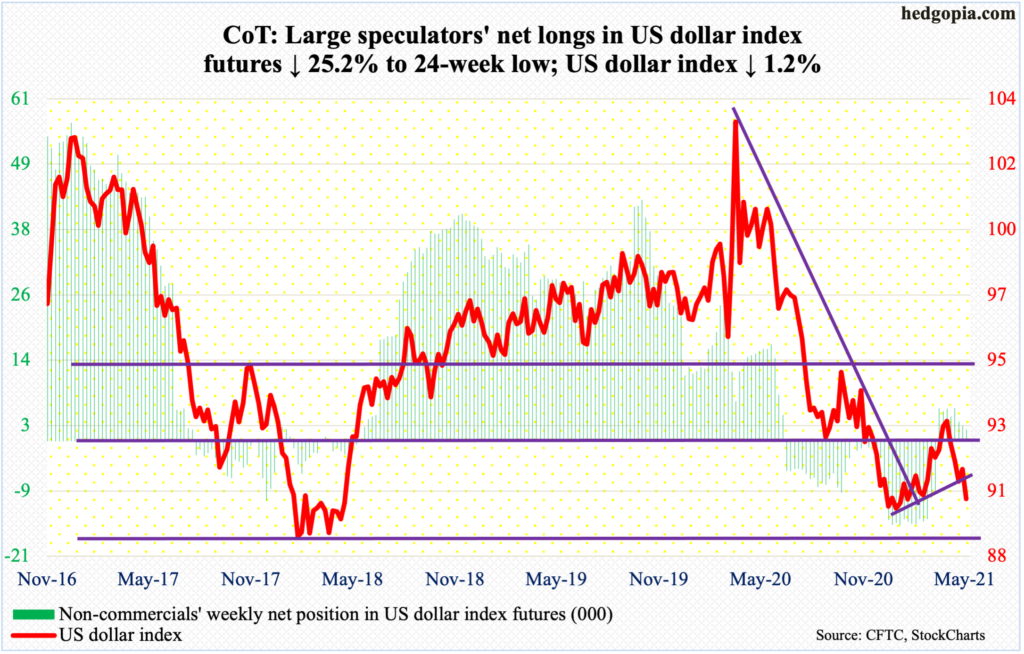
Last week, dollar bulls defended a rising trend line from January 6 when the US dollar index (90.22) bottomed at 89.17. Support at 88-89 goes back at least 17 years. This week, not only did they fail to build on that but also ended up losing it.
On Wednesday, the index rallied as high as 91.44, and that was it. Support just north of 92 was not even tested. On the daily, several indicators turned back down from the median mid-week.
The aforementioned support at 88-89 is in play again.
Ahead of this, non-commercials reduced their net longs to a 24-week low.
VIX: Currently net short 96.7k, up 2.7k.
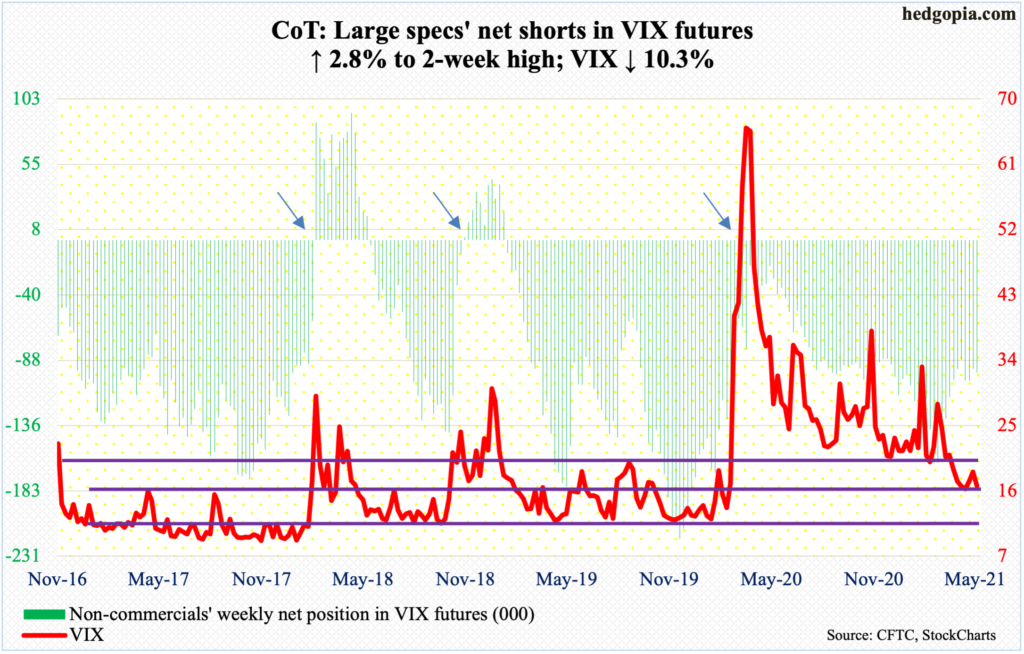
Despite last week’s constructive action in which VIX completed a potentially bullish 10- and 20-day crossover, volatility bulls came up short at important resistance.
Intraday Tuesday, VIX (16.69) rallied to tick 21.85 but only to leave behind a long upper shadow by close. On Thursday, a gravestone doji formed.
There is support at 15-16. On April 14, the volatility index dropped to 15.38 intraday before rallying back to close positive. A loss of this level exposes VIX to the low teens.


