
CoT This Week: First June Look At What Hedge Funds Are Buying
Following futures positions of non-commercials are as of June 1, 2021.
10-year note: Currently net long 54.8k, down 49.6k.
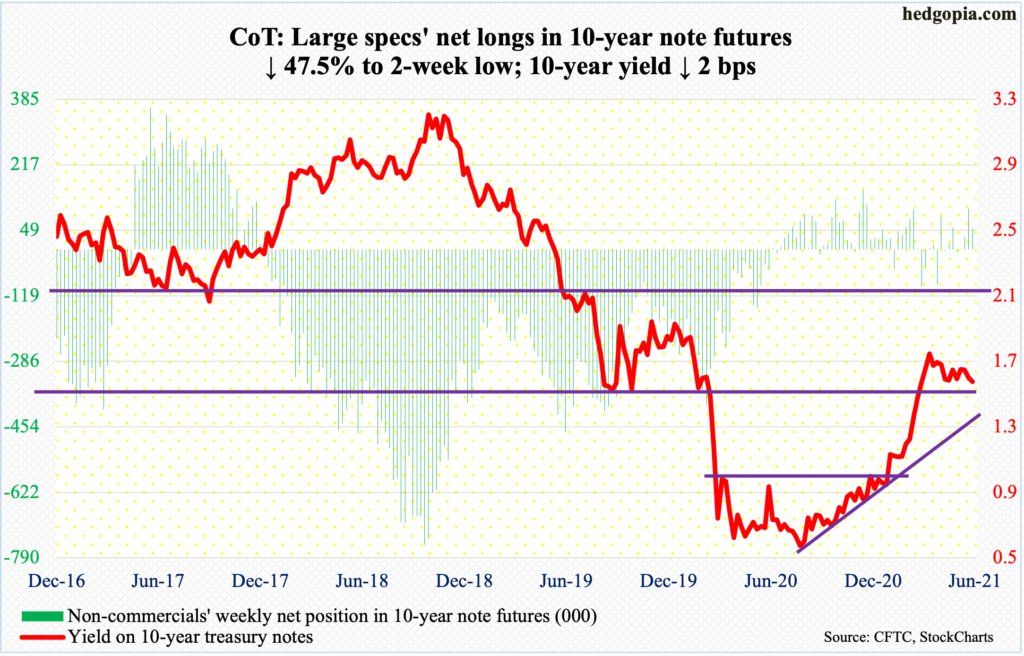
In all likelihood, a trial balloon was floated this week. On Wednesday, Patrick Harker, the Philadelphia Fed president who becomes a voting FOMC member in 2023, speaking at a virtual event, said, “it may be time to at least think about thinking about tapering our $120 billion in monthly Treasury bond and mortgage-backed securities purchases.”
Just so it does not upset the markets, he right away said, “this is not something we are going to do suddenly, though.” They are trying to prepare the markets for a day when the Fed starts unwinding its already-massive balance sheet. In early March last year, the central bank held $4.24 trillion in assets, which have since grown to $7.94 trillion. Who knows how high it gets before tapering begins?
Harker’s comments come amidst a pickup in inflation in particularly the last couple of months (chart here). Thus, he may just be trying to sooth the markets that the recent rise in inflation is transitory, which is the line used by Chair Jerome Powell, and his team, all along. Or, he is sensing early signs of persistent inflation and feels the need to warn that monetary stimulus has gone too far.
Either way, it is a no-win situation. If inflation proves transitory, then the Fed will continue to expand its asset base, driving risk-taking to dangerous levels. If it is persistent, and the Fed starts tapering, this will reverberate through a whole host of assets, not the least of which is equities. Already, stocks are beginning to cherish softer-than-expected data, fearing a strong economy will lead to tapering sooner than later.
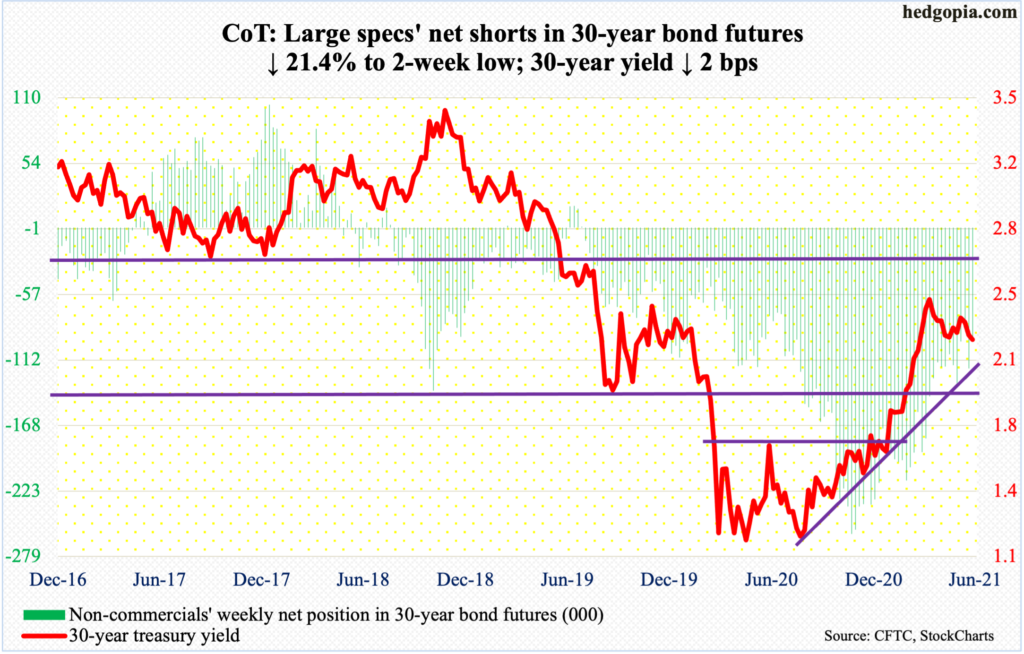
30-year bond: Currently net short 93.8k, down 25.6k.
Major economic releases for next week are as follows.
Tuesday brings the NFIB Optimism Index (May) and JOLTs (April).
Small-business job openings posted a new record in April by rising two points month-over-month to 44. In May last year, this sub-index languished at 23.
Non-farm job openings in March increased 597,000 m/m to 8.1 million – a new high. In April last year, openings reached a post-pandemic low of 4.6 million.
The CPI (May) is due out on Thursday. In the 12 months to April, headline and core CPI respectively jumped 4.2 percent and three percent, which was the steepest growth rate since September 2008 and January 1996.
The University of Michigan’s consumer sentiment index (June, preliminary) will be published on Friday. In May, consumer sentiment dropped 5.4 points m/m to 82.9 – a three-month low. Survey respondents expect 4.6 percent inflation next year and three percent in the next five years; last December, this was 2.5 percent for both periods.
WTI crude oil: Currently net long 536.4k, up 21.3k.
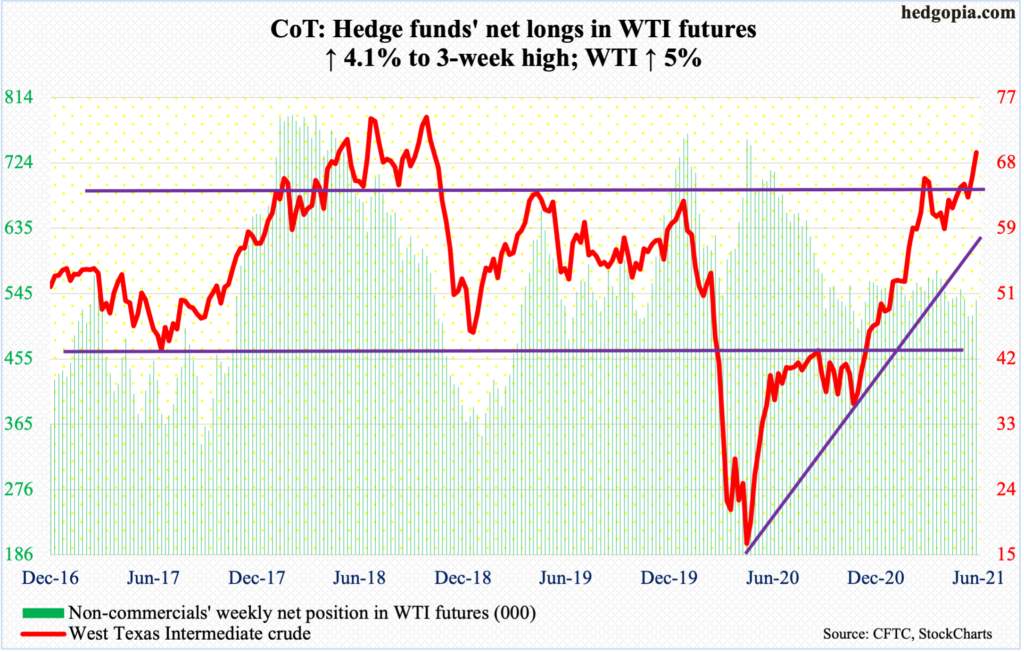
After trying for three months, oil bulls finally busted through resistance at $66-$67. The breakout occurred on Monday. WTI ($69.62/barrel) for the last several sessions rallied all along the rising daily upper Bollinger band. This is a level that bulls and bears have fought over dating back to 2006. So, the breakout, if it sticks, will be significant.
The catalyst this week was the decision by OPEC+ to stick to its existing plan of gradually raising output through July. In April, expecting better demand prospects, the group – made up of 13 OPEC and 10 non-OPEC oil-producing nations led by Russia – decided to raise output by 2.1 million barrels per day. Last year, it cut output by a record 9.7 mb/d.
This week’s breakout came amidst daily overbought conditions, unwinding of which is possible. How the crude behaves when a retest occurs will tell us a lot about if it will have the staying power to test its prior high of $76.90 from October 2018.
In the meantime, US crude production in the week to May 28 declined 200,000 b/d to 10.8 mb/d. Crude imports also fell – down 642,000 b/d to 5.6 mb/d. As did crude stocks, which dropped 5.1 million barrels to 479.3 million barrels. Gasoline and distillate stocks, however, rose – up 1.5 million barrels and 3.7 million barrels respectively to 234 million barrels and 132.8 million barrels. Refinery utilization was up 1.7 percentage points to 88.7 percent.
E-mini S&P 500: Currently net short 32.1k, up 13.6k.
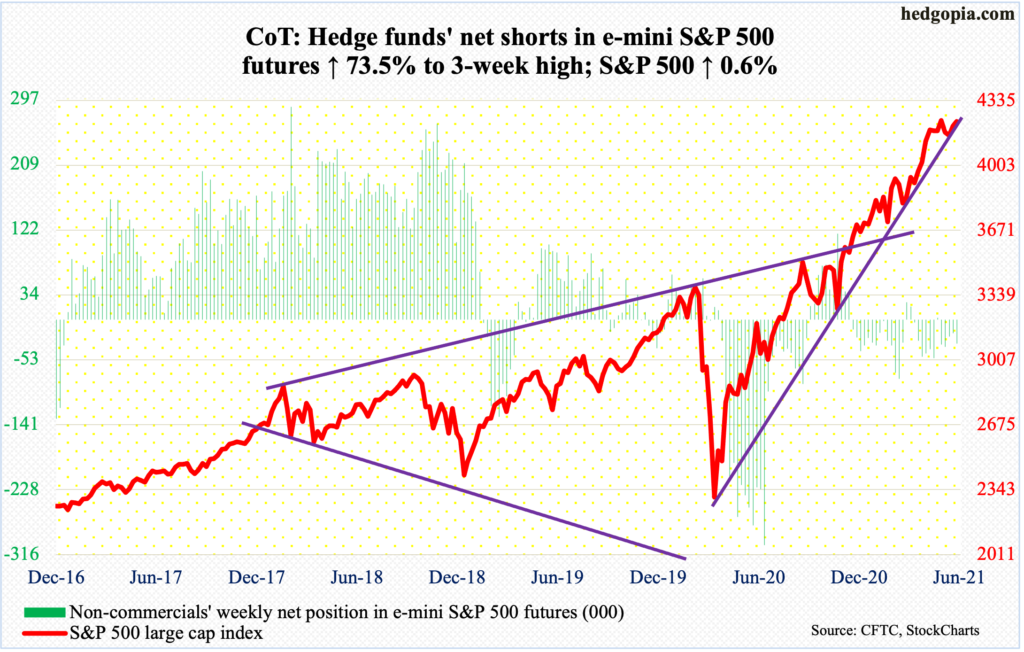
In the wake of three successive negative weeks during which $4.7 billion was withdrawn, SPY (SPDR S&P 500 ETF), VOO (Vanguard S&P 500 ETF) and IVV (iShares Core S&P 500 ETF) gained $1.9 billion in the week to Wednesday (courtesy of ETF.com). US-based equity funds, however, were not that fortunate, losing $4.6 billion in the same week (courtesy of Lipper).
The S&P 500 (4229.89) began the holiday-shortened week by rallying Tuesday within 3.92 points of matching the all-time high of 4238 from May 7. Bulls faced difficulty at 4210s for several sessions before the ceiling gave way on Friday. The large cap index looks to be itching to break out – for now.
Amidst this, it is worth pointing out that a rising trend line from the low of March last year was breached a couple of weeks ago, the underside of which is repelling rally attempts. May, up 0.6 percent, ended with a monthly dragonfly doji. On the weekly, this week ended up with a hanging man – 4th such candle in five weeks. Before that, a gravestone doji and a dragonfly doji appeared back-to-back.
Euro: Currently net long 109.3k, up 5.3k.
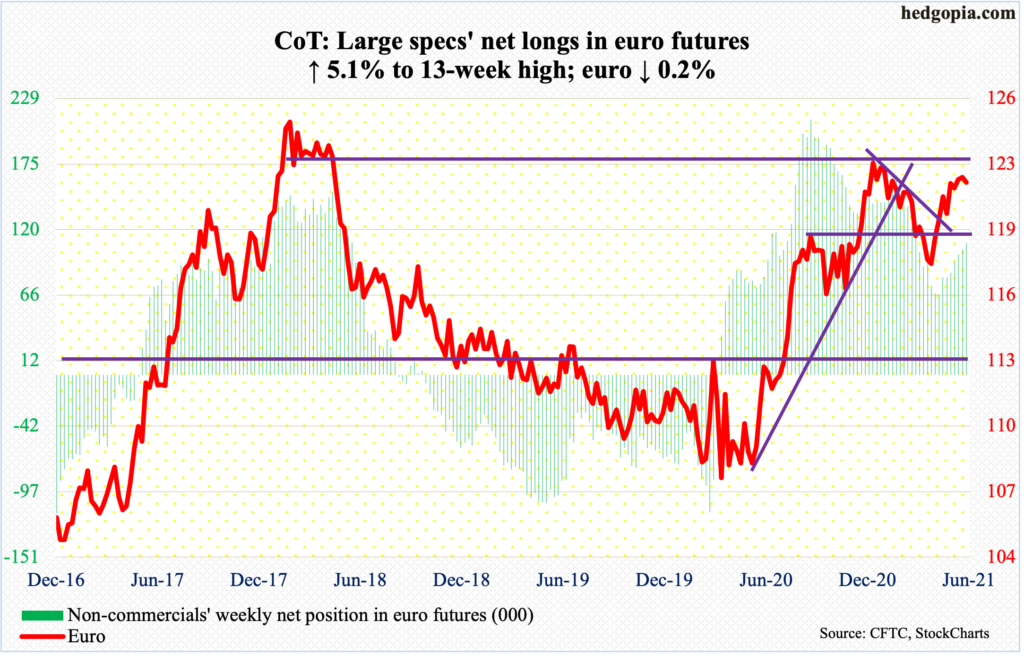
Last week, a weekly spinning top showed up on the euro. This week, the currency tagged $1.2256 intraday Tuesday but only managed to close at $1.2214, for a shooting star session. On Thursday, it lost shorter-term averages, albeit only slightly.
Before that, the euro ($1.2168) rallied from $1.1712 on March 30 to $1.2268 on May 25.
The daily remains overbought. There is crucial horizontal support at $1.19-$1.20, which goes back 18 years.
Gold: Currently net long 213.7k, down 941.
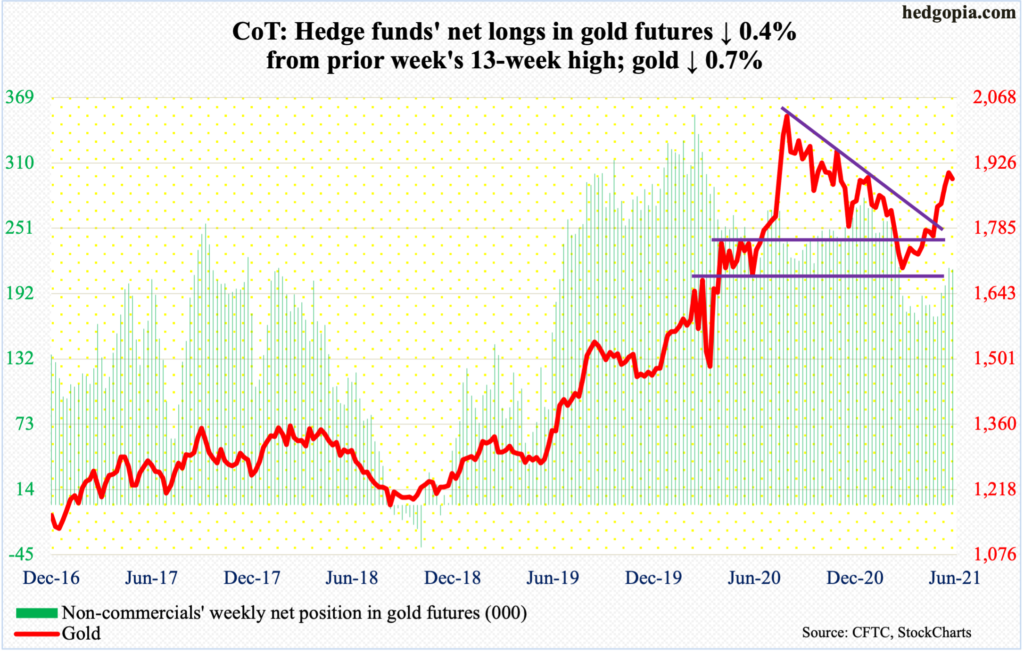
Resistance at $1,920s is proving formidable – for now (more on this here). This was the price point gold peaked back in September 2011 before coming under pressure to eventually bottom at $1,045 in December 2015. For 10 months now, bulls and bears have repeatedly fought for control of $1,920s, which was lost last November.
On Wednesday last week, gold ($1,892/ounce) tagged $1,916 in a long-legged doji session. On Tuesday this week, a spinning top formed as the metal hit $1,919. No breakout. On Thursday, it declined 1.9 percent, which was offset by a one-percent rally on Friday.
There is support at $1,870s, which was successfully tested on Thursday and Friday. This is followed by $1,850s, which approximates the 200-day at $1,846.
In the meantime, GLD (SPDR Gold ETF) in the week to Wednesday lost $142 million. In the prior three weeks, the ETF gained $1.5 billion (courtesy of ETF.com).
Non-commercials, too, after raising their net longs to a 13-week high last week, cut back slightly this week.
Nasdaq 100 index (mini): Currently net short 14.5k, up 1.3k.
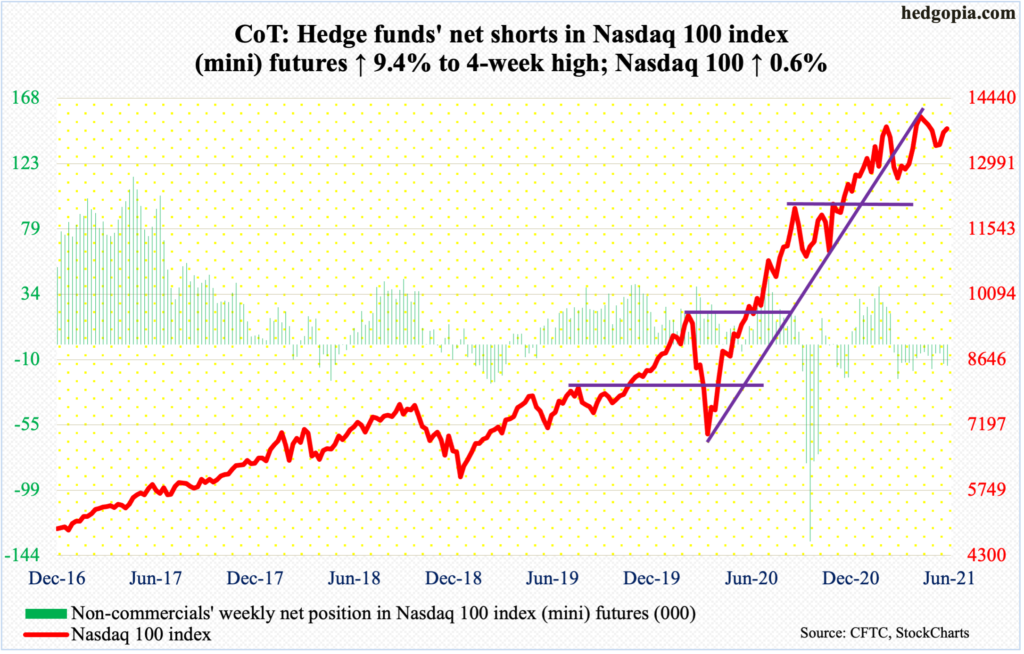
Twice last month, tech bulls showed up just under 13000. On both occasions, the 50-day had already been breached. After the price point was defended the second time, the average was reclaimed on May 24, but this has failed to lead to meaningful momentum. Sellers repeatedly showed up at 13720s. Thanks to Friday’s 1.8-percent jump, the Nasdaq 100 (13770.77) ended the week up 0.6 percent but also formed a dragonfly doji.
As soon as 2021 began, several potentially bearish monthly candles began to pop up. January produced a long-legged doji, February a dragonfly doji and March a gravestone doji; April’s 5.9-percent rally in which a new all-time high of 14073 was posted tried to neutralize these candles, but May, down 1.3 percent, formed a hanging man. June so far is up 0.6 percent.
Russell 2000 mini-index: Currently net short 35.4k, up 1.5k.
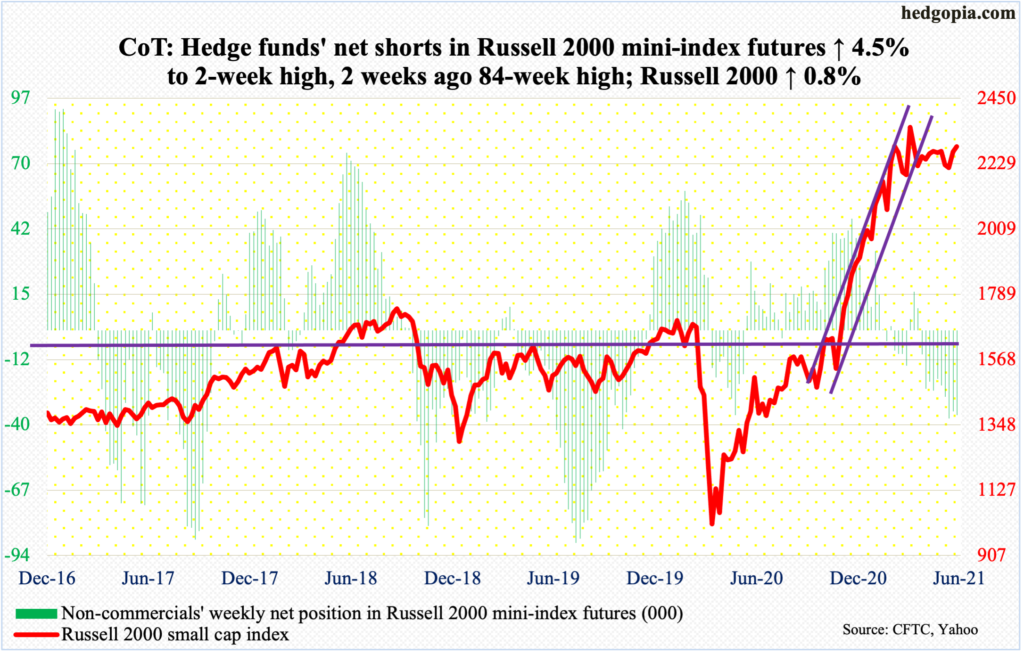
The Russell 2000 (2286.41) touched 2302 intraday Wednesday to take out straight-line resistance at 2280s, but small-cap bulls failed to hang on to the gains. This was also a slightly lower high from the one posted on April 29 which tagged 2323. The all-time high of 2360 was set on March 15.
Beside a pattern of lower highs over nearly three months, the risk of a potential head-and-shoulders formation remains. The neckline is at 2070s-2080s.
US Dollar Index: Currently net long 3k, up 183.
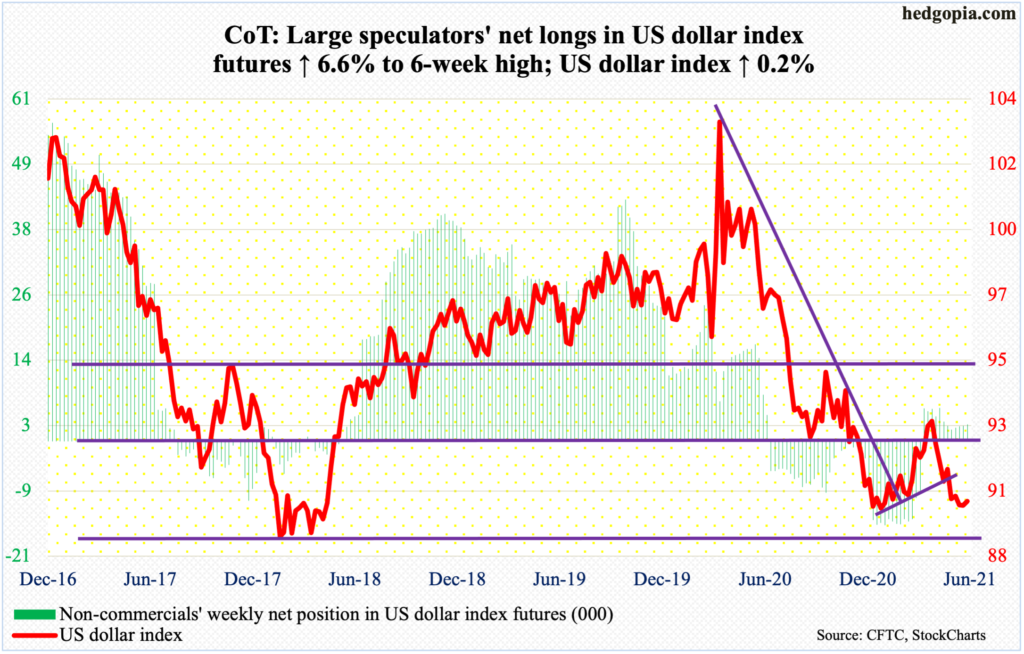
The US dollar index (90.13) swung lower from 93.47 from March 31 to last week’s low of 89.52. Last week – essentially unchanged – was a long-legged doji week; the weekly low of 89.52 undercut the prior week’s low of 89.63 but not quite the low of 89.17 from January 6.
Support at 88-89 goes back at least 17 years. Dollar bulls are trying their best to defend the level – and succeeding so far. This week, the index edged higher 0.2 percent. As long as 88-89 is intact, bulls deserve the benefit of the doubt.
Near term, there is resistance at 90.30s.
VIX: Currently net short 61.8k, up 850.
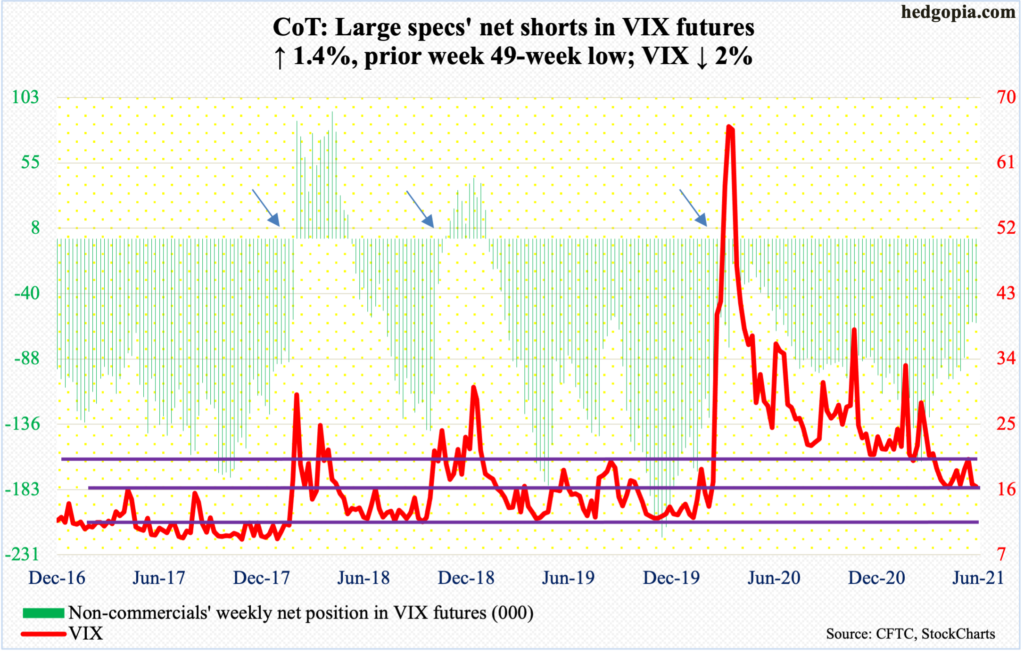
Tuesday’s low of 15.68 was only 0.30 points from matching the low of 15.38 from April 14. That was a spinning top low; ditto with this Tuesday’s.
Despite this, the status quo remains, which is volatility bulls’ inability to hold the rallies. Wednesday’s high of 19.27 would have been enough to take out the 50-day if it held, but it did not, closing at 18.04. The average once again repelled Friday’s rally attempt.
VIX acts like it wants to see the 15 handle again.


