
CoT Report This Week: What Hedge Funds Are Buying, Noncommercial Positions
Following futures positions of non-commercials are as of February 22, 2022.
10-year note: Currently net short 285.1k, up 111k.
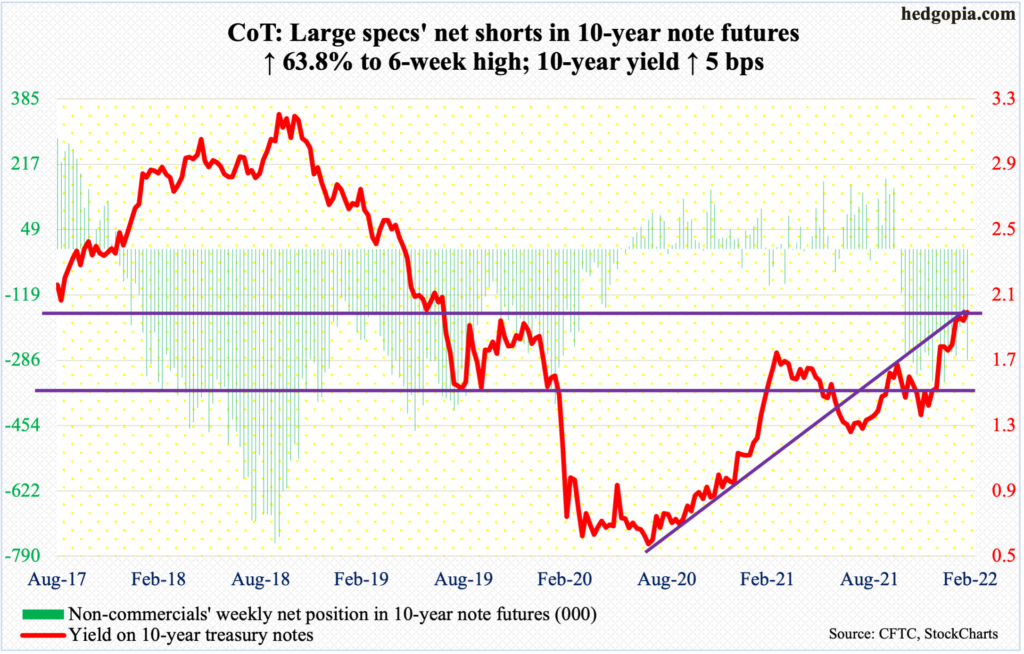
After back-to-back weekly spinning tops in 10-year treasury rates in the last two weeks, bond bears (on price) defended 1.86 percent this week. The weekly low was posted on Thursday, when the 10-year then rallied strongly to close at 1.97 percent. Earlier on the 16th (this month), yields tagged 2.07 percent, which was the highest since July 2019, before retreating. As recently as December 3, these notes were yielding 1.34 percent.
Having failed to sustain above two percent month-to-date and with several indicators in overbought territory, rates’ path of least resistance over the next several weeks is probably lower. The 10-year has come a long way. The Ukraine situation has further muddied the waters, not to mention the fact that this will now be used by FOMC doves as more reason “not to overdo it,” as Neel Kashkari, president of the Minneapolis Fed, put it last week.
The 10-year’s (1.99 percent) real test lies at 1.77 percent, which it broke out of last month.
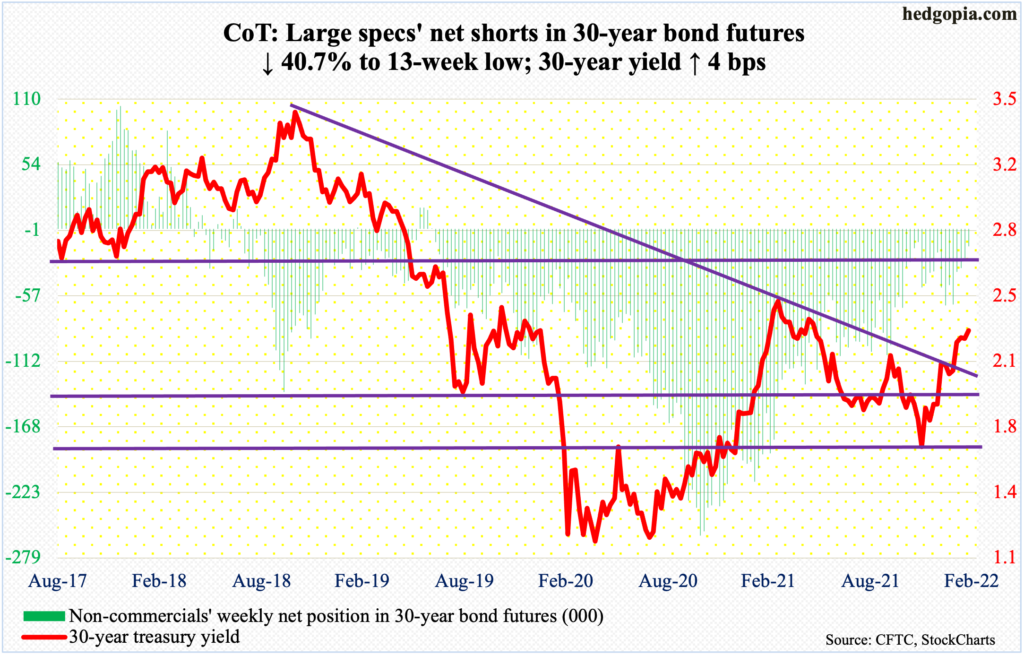
30-year bond: Currently net short 14.7k, down 10.1k.
Major economic releases for next week are as follows.
The ISM manufacturing index (February) is scheduled for Tuesday. In January, manufacturing activity declined 1.2 percentage points month-over-month to 57.6 percent. This was a back-to-back sub-60 reading.
Thursday brings productivity (4Q21, revised), the ISM non-manufacturing index (February) and durable goods orders (January, revised).
Non-farm output/hour increased two percent year-over-year in 4Q21. This was a three-quarter high.
Services activity in January fell 2.4 percentage points m/m to 59.9 percent – first sub-60 reading in 11 months.
Preliminarily, January orders for non-defense capital goods ex-aircraft – proxy for business plans for capital expenditures – were up 0.9 percent m/m to a seasonally adjusted annual rate of $80 billion, which is a new record.
Non-farm payrolls (February) are on dock for Friday. After a monthly average of 555,000 non-farm jobs last year, January added another 467,000. With this, from the post-pandemic low of 130.5 million, 19.1 million jobs have been created, which means an additional 2.9 million will bring the tally on par with the February 2000 record high of 152.5 million.
WTI crude oil: Currently net long 335.9k, down 9k.
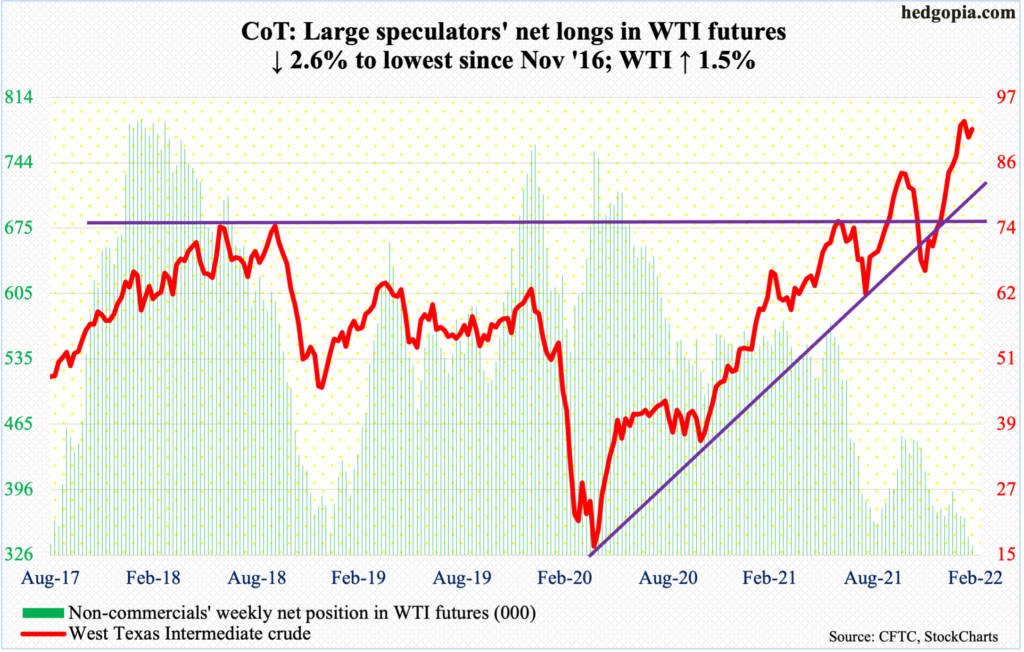
In Thursday’s wild session, oil bulls used the session’s intraday spike to lock in profit, with WTI ($91.59/barrel) tagging $100.54 and closing at $92.81. This was the first time since July 2014 the crude crossed $100. Back then, oil rose as high as $107.68 in June that year, before the rug was pulled out from underneath; Russia’s invasion and the subsequent annexation of the Crimean Peninsula led to the price spike. Eight years later, once again Russia is in the thick of it, with its invasion of Ukraine this week. Leading up to this, oil had rallied massively, with WTI ticking $62.43 on December 2.
The ’buy the rumor, sell the news’ phenomenon is probably in play. Monday’s low of $87.46 is worth a watch, and horizontal support at $85 after that.
In the meantime, US crude production in the week to February 18 was unchanged at 11.6 million barrels per day. Crude inventory was up 4.5 million barrels to 416 million barrels. As were crude imports, which rose one mb/d to 6.8 mb/d. Stocks of gasoline and distillates, however, declined 582,000 barrels and 584,000 barrels respectively to 246.5 million barrels and 119.7 million barrels. Refinery utilization increased 2.1 percentage points to 87.4 percent.
E-mini S&P 500: Currently net long 236.4k, up 41.3k.
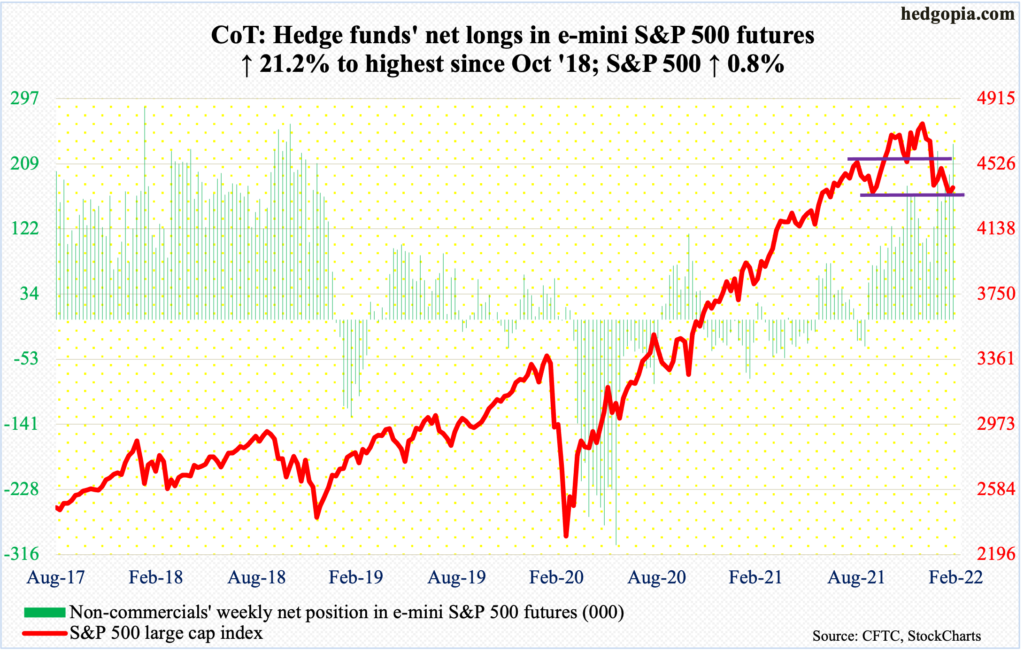
Bulls averted a major breakdown this week. The S&P 500 closed Wednesday at 4225, which was not only a test of its late-January low but also formed the neckline of a potentially bearish head-and-shoulders formation (more on this here). In fact, the session started with a huge gap-down as the index was down 2.6 percent in the opening minute but that low bought hand over fist. By then, the large cap index was down just under 15 percent from its January 4 record high. When it was all said and done, Thursday reversed higher 1.5 percent.
Leading up to this, Investors Intelligence bulls were in the 30s for six consecutive weeks; this week, their count declined 1.5 percentage points week-over-week to 32.2 percent, with bears up 3.1 percentage points to 31 percent, for a ratio of 1.04, which is well into oversold territory (more on this year).
The rally can continue – if nothing else just to unwind the oversold condition the S&P 500 (4385) finds itself in. The 200-day lies at 4461 and the 50-day at 4559, with the latter approximating a 61.8-percent Fibonacci retracement of the January 4-February 24 decline at 4550.
In the meantime, non-commercials are now aggressively net long. This is worth watching, as at some point this becomes lopsidedly bullish, raising reversal odds.
Euro: Currently net long 59.3k, up 11.7k.
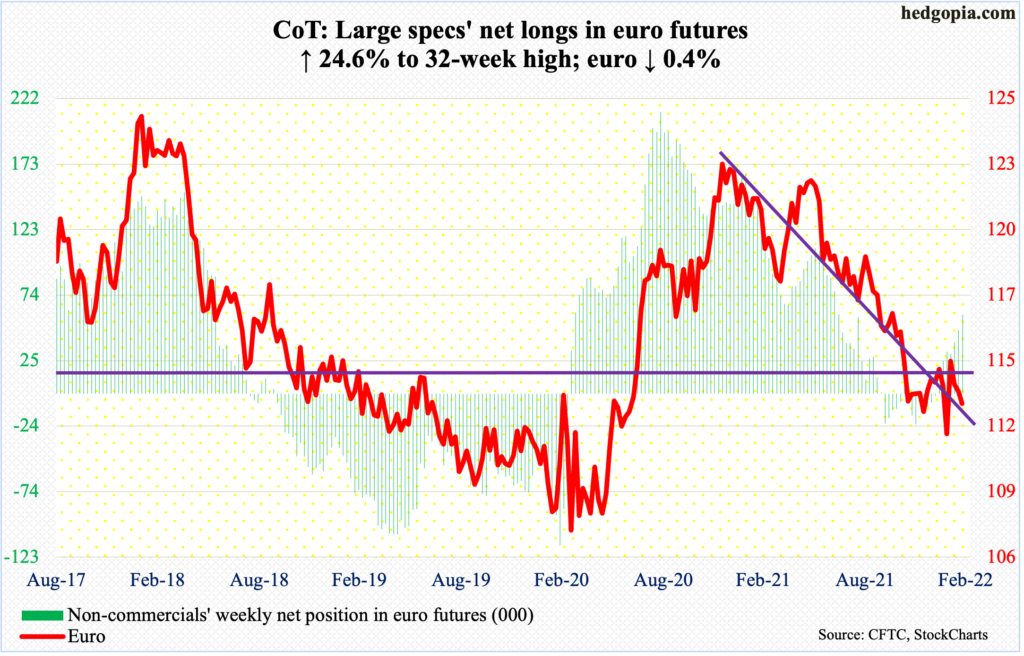
Russia’s invasion of Ukraine drove euro bulls fleeing to safety. On Thursday, the currency shed 0.9 percent and was down as much as 1.2 percent at one time; the session low of $1.1105 slightly undercut the January 28 low of $1.1125 but was saved on time, closing at $1.1209.
Thursday’s gap fills at $1.13. The 50-day at $1.1329 lies around there. The euro closed out the week $1.1272. If it manages to get there, sellers likely will reappear.
Gold: Currently net long 243.1k, up 29.5k.
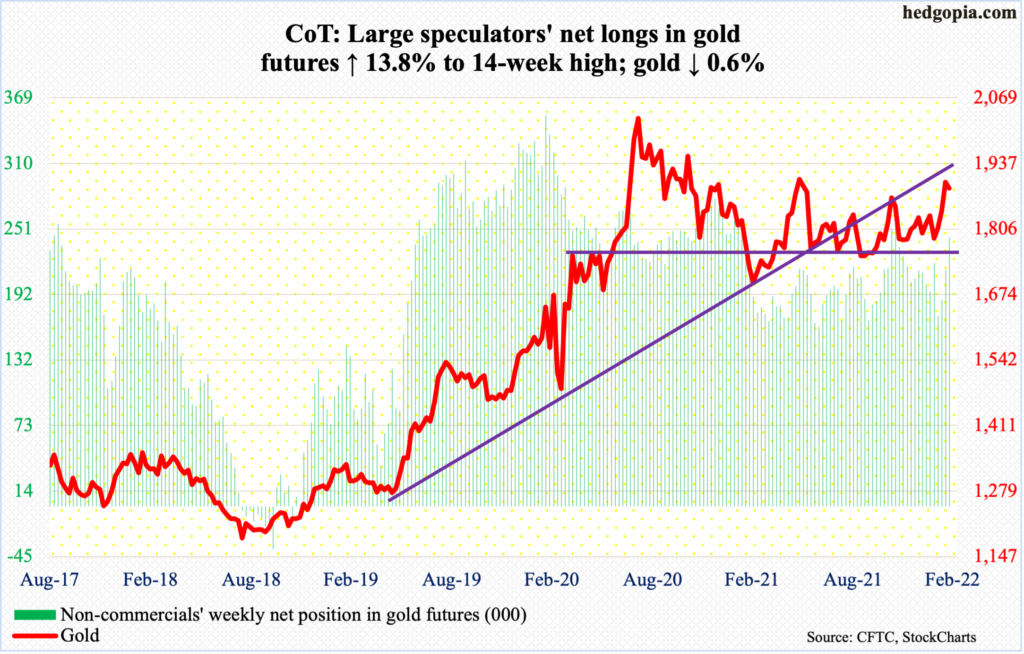
Thursday was wild, with a high of $1,976 and a low of $1,879, closing at $1,926. Had gold bugs been able to hold on to the gains, gold would have staged a massive breakout.
In September 2011, the yellow metal retreated after touching $1,924. Gold did not bottom until December 2015 when it tagged $1,045. The prior high was surpassed in July 2020, followed by a new high $2,089 in August that year. A decisive break of $1,920s would have opened the door toward that high.
As things stand, gold ($1,888/ounce) probably would like to take a breather to shake off its overbought condition. Thursday’s low, which was also where the metal began its retreat on November 16, is worth a watch.
Nasdaq 100 index (mini): Currently net long 13.9k, up 4.6k.
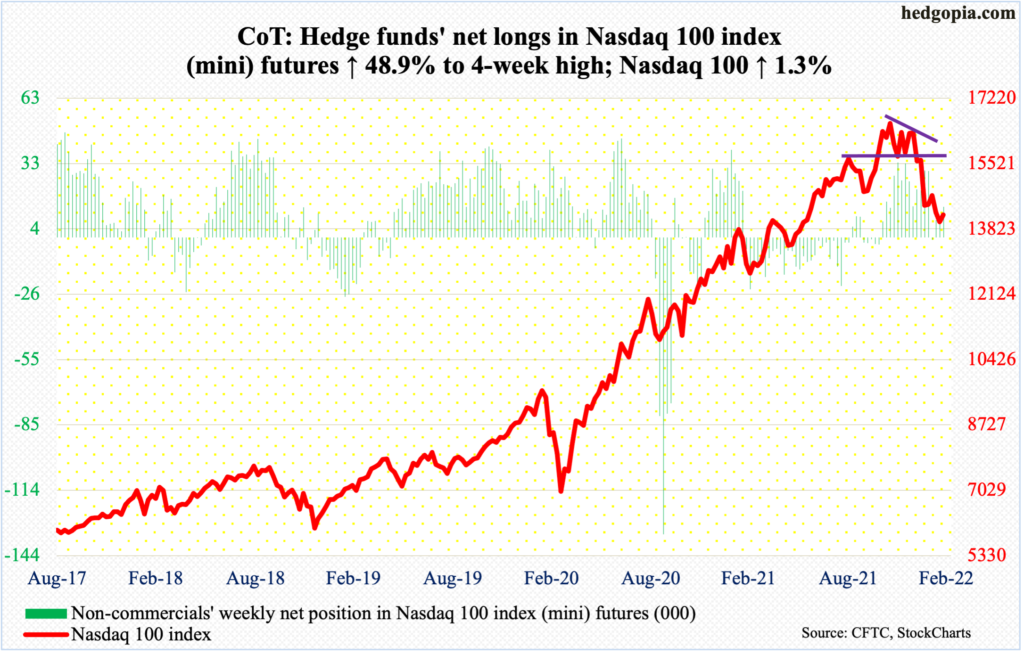
From down 3.3 percent at the session low (13065) to up 3.4 percent at close, the Nasdaq 100 finished Thursday with a bullish marubozu candle. The reversal came after the tech-heavy index dropped 22.1 percent from the November (last year) high of 16765.
During that decline, the Nasdaq 100 (14189) suffered technical damage, and that requires time to repair. For now, the path of least resistance is up. A falling trend line from early January gets tested at 14500. In the event of renewed pressure, bulls need to defend 13700s.
Russell 2000 mini-index: Currently net short 26.1k, down 5.6k.
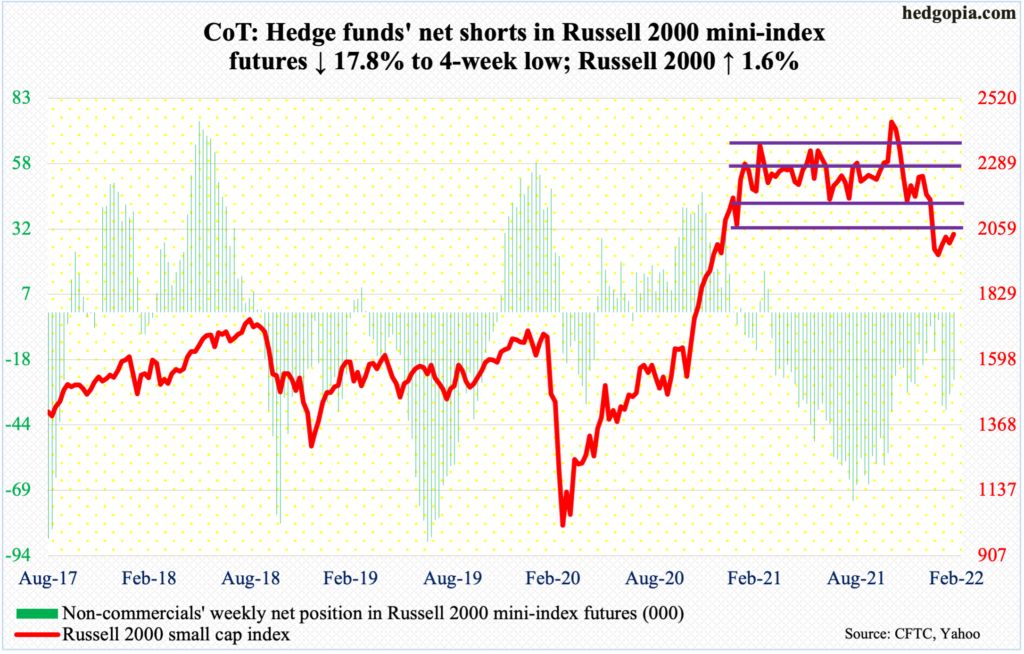
Thursday’s 100-plus-point swing went to small-cap bulls’ way; bears started strong out of the gate, with the Russell 2000 gapping down and the session low of 1894 slightly undercutting the January 28 low of 1901. But there were bids waiting at that support.
In the sessions ahead, bulls should hope for at least a back-test of the box breakdown of January 19 when the small cap index (2041) breached 2080s.
From March last year through last month, the Russell 2000 was rangebound between 2350s and 2080s, and between 2280s and 2150s within this rectangle. On Nov 3, it broke out but was quickly followed by a failed retest on the 19th (November), followed by a range breakdown last month.
US Dollar Index: Currently net long 36.1k, up 698.
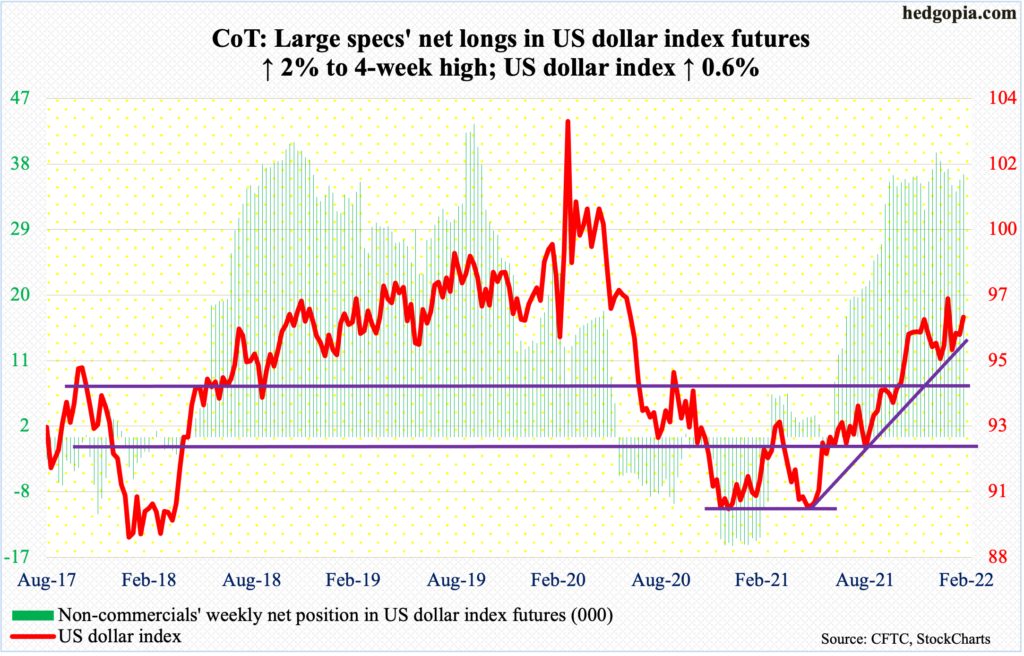
Thursday’s intraday high of 97.74 helped the US dollar index establish a higher high but finished the session rather poorly at 97.12, up a percent. For the week, it closed up 0.6 percent to 96.62.
Horizontal resistance around 97 goes back at least 18 years. The weekly has room to head higher, but until this resistance gives way decisively, downward pressure may soon intensify.
VIX: Currently net short 45.6k, down 475.
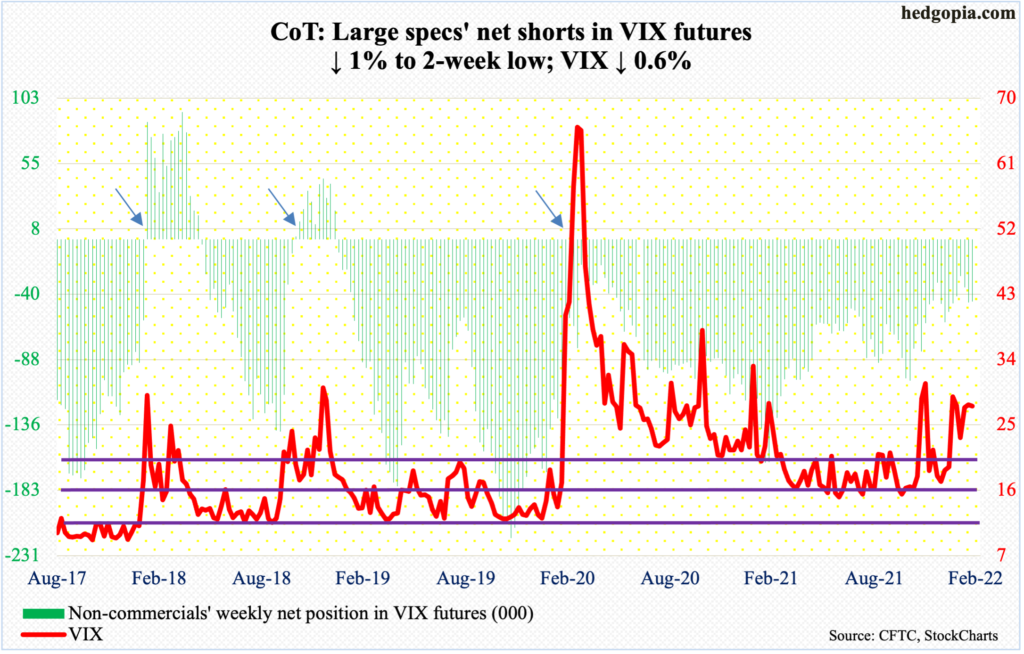
Since early December (last year), VIX (27.59) has found it difficult to sustain above 32-33. Volatility bulls had a big opportunity to achieve that feat on Thursday, but only to end the session with a massive reversal, having rallied as high as 37.79 but closed at 30.32. Thursday’s high also fell short of the January 24 high of 38.94.
This week’s spike reversal should lead to downward pressure in the sessions ahead. There is support at mid-20s, and low-20s after that.


