
CoT: Positions Of Non-Commercials, The Future Via Futures
Following futures positions of non-commercials are as of September 8, 2020.
10-year note: Currently net long 9.5k, up 23k.
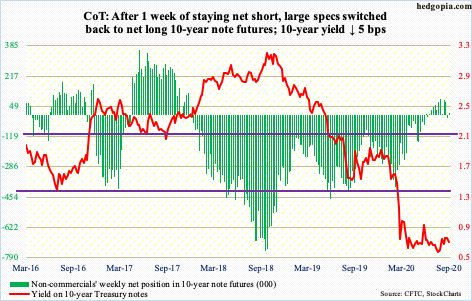
The FOMC meets this week. After the Tuesday-Wednesday meeting, two more remain this year – November 4-5 and December 15-16. As far as policy matters are concerned, not much is expected out of these meetings.
A lot already took place in March-April, with March in particular holding two unscheduled meetings. This was when the fed funds rate was pushed to a range of zero to 25 basis points, an open-ended QE was begun and the Fed announced it would start buying investment-grade corporate bonds, which in April was expanded to also include junk bonds.
Consequently, in three months between early March and early June, the central bank’s assets expanded $2.93 trillion to $7.17 trillion. They have since come down by $158.3 billion, but at $7 trillion as of Wednesday remain massive. After having provided this kind of stimulus, adding more to the balance sheet is hard to justify considering the US economy and stocks are substantially off the lows of February-April.
US equities have taken a hit the past couple of weeks, with the S&P 500 large cap index down just under seven percent from last Wednesday’s record high. If a single digit decline like this meets the threshold of setting off alarm bells at the Eccles Building, then markets will more likely wonder ‘what does the Fed know?’ than get soothed by extra stimulus.
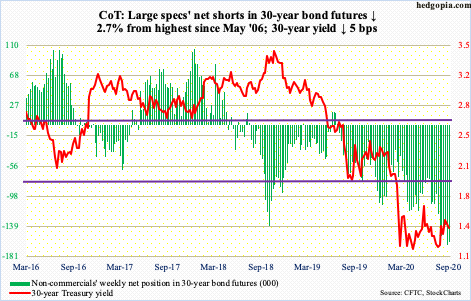
30-year bond: Currently net short 160.4k, down 4.4k.
Major economic releases next week are as follows.
Industrial production/capacity utilization (August) is due out Tuesday. Utilization increased 3.1 percent month-over-month in July to 70.6 percent. In April, utilization was 64.2 percent.
Retail sales (August), the NAHB housing market index (September) and the Treasury International Capital data (July) are scheduled for Wednesday.
July retail sales increased 1.2 percent m/m to a seasonally adjusted annual rate of $536 billion – a new record. This is quite a reversal from April when sales were down to $412.8 billion, which was a seven-year low.
Homebuilder sentiment rose six points m/m in August to 78, matching December 1998’s record. The index is now up 48 points From April when it tumbled to the lowest since June 2012.
In the 12 months to June, net foreign purchases of US equities totaled $165.2 billion – the highest since April 2010. This represents quite a U-turn in their sentiment. In April last year, they were selling $214.6 billion worth – a record.
Housing starts (August) are on tap for Thursday. In July, starts rose 22.6 percent m/m to 1.5 million units (SAAR). Activity is up 60.2 percent from April’s 934,000, which was the lowest since February 2015.
Friday brings the University of Michigan’s consumer sentiment index (September, preliminary). Sentiment rose 1.6 points m/m in August to 74.1. Earlier, the index dropped from 101 in February to 71.8 in April.
WTI crude oil: Currently net long 524.5k, down 48.4k.
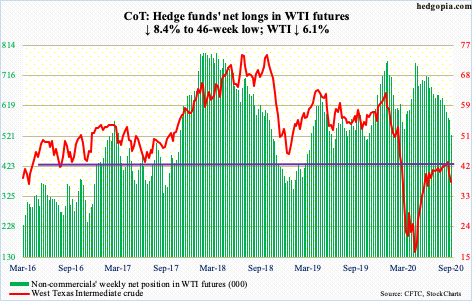
After losing a confluence of moving-average support late last week, WTI ($37.33/barrel) came under pressure this week, losing 6.1 percent, for a back-to-back down week. Between $41.46 and $40.04, 10-, 20-, 50- and 200-day all lie. Tuesday’s intraday low of $36.13 held minor support at $36. There is decent support at $34-35; odds of a relief rally grow if this price level is successfully defended.
In the meantime, US crude production increased 300,000 barrels per day to 10 million b/d. In February/March, production peaked at 13.1 mb/d. Crude imports rose 523,000 b/d to 5.4 mb/d. Crude stocks grew two million barrels to 500.4 million barrels. Gasoline and distillate stocks, however, dropped – respectively by three million barrels and 1.7 million barrels to 231.9 million barrels and 175.8 million barrels. Refinery utilization declined 4.9 percentage points to 71.8 percent.
E-mini S&P 500: Currently net long 18.3k, up 43.9k.
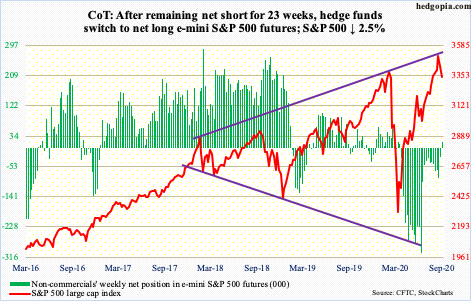
After losing $9.6 billion in the prior three weeks, SPY (SPDR S&P 500 ETF), VOO (Vanguard S&P 500 ETF) and IVV (iShares Core S&P 500 ETF) collectively gained $7.8 billion in the week to Wednesday (courtesy of ETF.com). These inflows came in a down week. US-based equity funds, meanwhile, continued to bleed, down another $1.9 billion in the week to Wednesday (courtesy of Lipper).
Wednesday, bulls tried to repair the damage sustained in the prior three sessions; the S&P 500 (3340.97) rallied two percent in that session, but at the same time faced resistance at the 20-day, which, along with the 10-day, is now pointing down. There is no cross-down yet but seems imminent. Thursday’s rally attempts were again sold at the 20-day. Friday, the 50-day (3321.56) was breached slightly but saved by close. A breach opens the door to a test of straight-line support between 3230s and 3270s.
Importantly, non-commercials are now net long. They went net short in the week to March 31, which was the week after the S&P 500 bottomed. Through last Wednesday’s high, the index went on to rally 64 percent, helped by these traders who were squeezed. They were net short until last week. This week, they went net long. This fuel is no more.
Euro: Currently net long 196.8k, up 67.
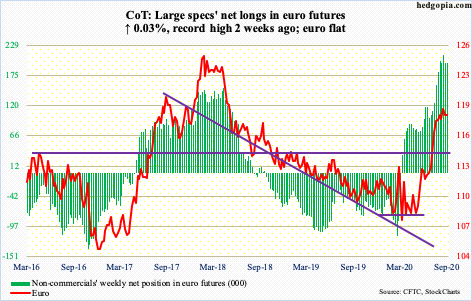
Thursday’s intraday high of $1.1917 once again saw euro bulls go after 17-plus-year resistance at $1.19-1.20, and, as has been the case the past five weeks, met with failure. At the same time, they have managed to defend $1.17-$1.175, including this week.
The ongoing consolidation follows a rally from March when on the 20th the euro ($1.1844) tagged $1.064 intraday. On the 1st this month, it hit $1.201. Bulls obviously would like the current rangebound action to resolve with a breakout, but unless $1.19-1.20 is convincingly taken out, odds are against them.
The currency remains overbought on both the weekly and monthly. Non-commercials, who are net long euro futures to the gills, are the wildcard. A breach of $1.17-1.175, followed by the 50-day at $1.1691, can potentially lead these traders to lighten up. After this, there is horizontal support at $1.145.
Gold: Currently net long 236.5k, up 5.7k.
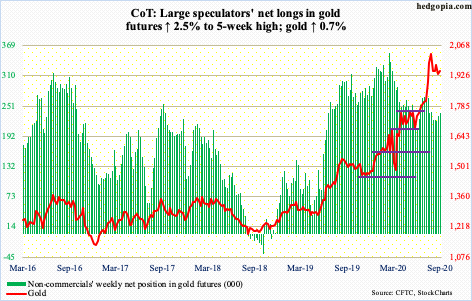
IAU’s (iShares Gold Trust) streak of inflows extended to 25 weeks, as it took in another $185 million in the week to Wednesday, for a cumulative total of $7.7 billion. GLD’s (SPDR Gold ETF) has been a little spotty in that it saw outflows in four of the 25, with $179 million coming in this week, for a cumulative 25-week total of $18.3 billion (courtesy of ETF.com).
These longs obviously expect better things to come for the metal. Gold ($1,947.90/ounce) rallied from $1,450.90 on March 16 to record high $2,089.20 on August 7. On its way there, the metal surpassed the prior high of $1,923.70 from September 2011 seven trading weeks ago. The breakout is being consistently tested for a month now – successfully thus far. Tuesday’s intraday low of $1,911.70 also tested the slightly rising 50-day – once again successfully. As long as these levels hold, gold bugs deserve the benefit of the doubt. A decisive breach opens the door to a test of $1,750-1,800.
Non-commercials have added to their net longs for two weeks now.
Nasdaq 100 index (mini): Currently net short 18.5k, up 27.1k.
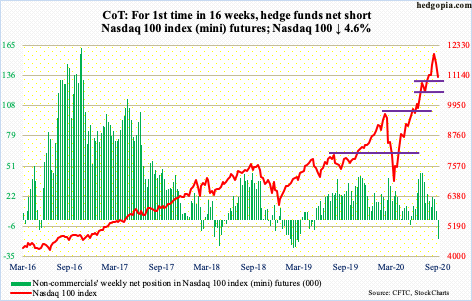
Tech bulls tried to put foot down Wednesday when they rallied the Nasdaq 100 three percent. Earlier on Tuesday, after a three-session, 11.1-percent tumble, the index landed right on the 50-day (11131.05). Come Thursday, the average was tested again as intraday rally attempts petered out. Friday, the average was breached, albeit slightly.
The index (11087.40) is now below both the 10- and 20-day. Thursday’s intraday high of 11566.34 retreated from just under the 20-day as well as kissed the underside of now-broken rising channel from March (more on this here). Once 11000 gives way, next area of support lies at 10300-10400.
Non-commercials, who went net short this week, are probably anticipating one.
In the week to Wednesday, QQQ (Invesco QQQ Trust) lost $555 million (courtesy of ETF.com).
Russell 2000 mini-index: Currently net long 15.6k, up 7.3k.
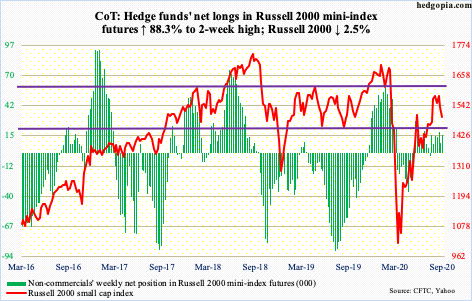
Last Thursday, the Russell 2000 (1497.27) sliced through a rising trend line from its March low. This was preceded a month ago by rejection at major resistance just north of 1600, which goes back to January 2018.
After the March trend line was breached, sellers began to show up at 1530s, even as small-cap bulls were clinging on to the 50-day (1514.90). There is now a 10/20 cross-down (respectively at 1542.72 and 1555.68), with the 200-day at 1463.70, which aligns with horizontal support at 1450s-60s. After this, there is support at 1340s-50s.
US Dollar Index: Currently net short 5.8k, down 988.
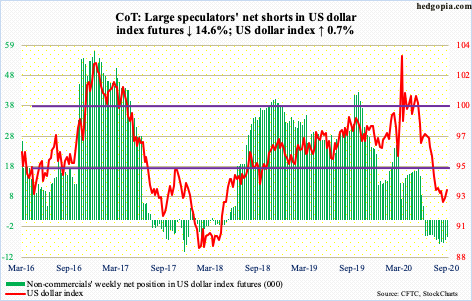
Wednesday’s intraday high of 93.64 was repelled at the daily upper Bollinger band. This area is important because in the first half of August dollar bulls were denied just under 94 a few times. The 50-day at 94.02 lies right above.
Bulls have done a good job of defending 92 on the US dollar index (93.34) after a five-plus-month drop from 103.96 on March 23 to 91.75 on the 1st this month. They now need to clear 94 before momentum shifts upward. The 10/20 moving averages are on the verge of a potentially bullish crossover.
VIX: Currently net short 91.6k, down 4.1k.
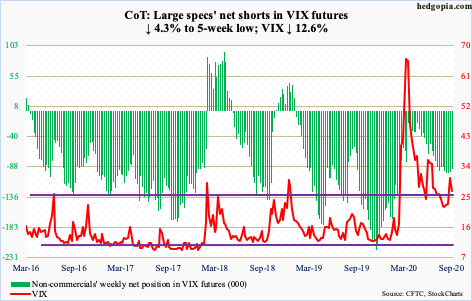
Last Friday, VIX rallied through 36-37 resistance intraday but ended down 2.85 points to 30.75; the volatility index was unable to rally even though equities were down in that session. Tuesday this week, VIX – once again – rallied to 35.93 intraday but closed at 31.46. Friday, the 200-day (28.69) was lost, raising the odds VIX gets pulled toward the 50-day at 25.53, which also approximates horizontal support (more on this here).
Regardless what happens near term, VIX (26.87) has room to go a lot higher medium- to long-term.
The 21-day moving average of the CBOE equity-only put-to-call ratio has a long way to go before the built-in froth is unwound. Last Wednesday, it dropped to 0.439 – a new low. This week, it closed at 0.486. If past is prelude, the ratio can rise all the way to low- to mid-0.70s before sentiment switches to overly cautious – the opposite of the overly optimistic currently.


