
CoT: Peeking Into The Future Via Futures, Hedge Fund Buying
Following futures positions of non-commercials are as of March 9, 2021.
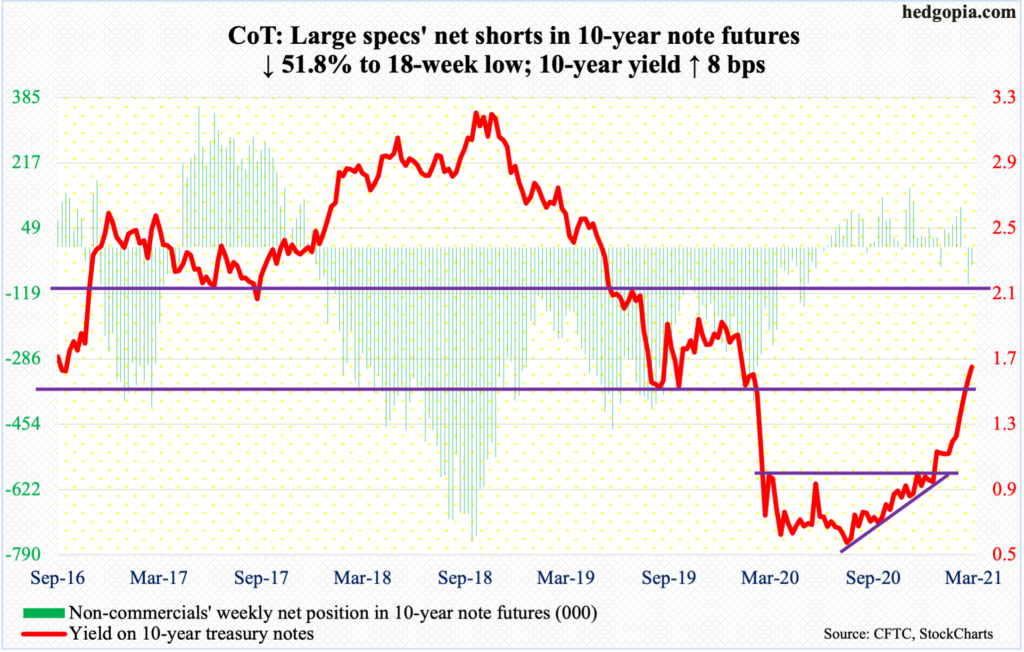
10-year note: Currently net short 46.1k, down 49.5k.
The FOMC meets next week. This is the year’s second meeting. Six more remain – the scheduled ones, that is.
A lot has happened since the last meeting, particularly on the yields front. Rates on the long end of the treasury yield curve have firmed up. When the last meeting ended on January 27, the 10-year yielded 1.01 percent, having broken out of one percent early that month. This week, these notes closed out Friday yielding 1.64 percent – a 13-month high.
Markets are not liking this and hoping that the Fed would do something to arrest the uptrend. Speaking at a public event on the 4th this month, Chair Jerome Powell refused to acquiesce to markets’ increasing optimism for some version of Operation Twist, in which the Fed sells short-term notes and buys long-term notes and bonds. The central bank has been spending up to $120 billion/month in purchases of mortgage-backed securities and treasury notes and bonds.
So, at the end of next week’s meeting on Wednesday, markets will be on pins and needles as to if the Fed announces something to cap rates on the long end. The meeting is also taking place at a time when banks are clamoring for SLR (supplementary leverage ratio) extension.
Last April – post-Covid – US regulators eased SLR requirements, which were put in place in the wake of the great financial crisis. Banks were required to have equity capital equal to three to five percent of their assets back then. Last year’s exemption allowed them to exclude US treasuries and cash kept in reserve at the Fed from their assets when calculating the ratio.
If the exemption is not extended, banks likely will try to reduce their treasury holdings. Alternatively, it is very possible that, sensing that the regulators were not going to extend the exemption, banks are already liquidating at least some of their holdings, putting upward pressure on the rates.
We are likely to find out next week the fate of this exemption.
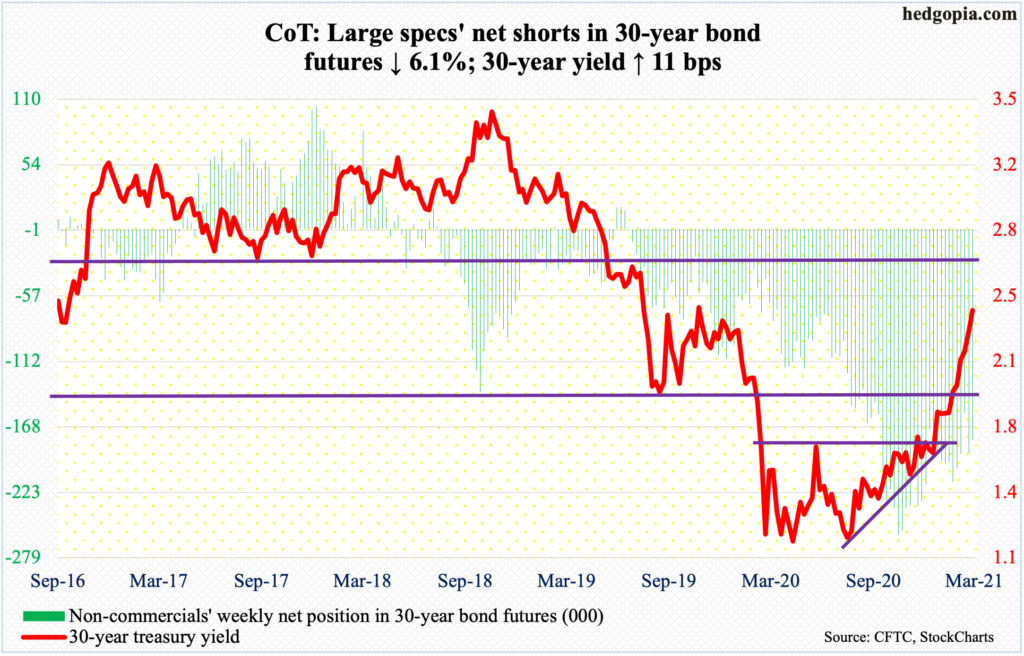
30-year bond: Currently net short 178.8k, down 11.5k.
Major economic releases for next week are as follows.
Monday brings Treasury International Capital data (January). In 2020, foreigners purchased $368.3 billion in US stocks – a new record – up from $504 million in 2019.
On Tuesday, retail sales (February), industrial production (February) and the NAHB Housing Market Index (March) will be published.
In the 12 months to January, retail sales jumped 7.4 percent to a seasonally adjusted annual rate of $568.2 billion – a new high.
In January, capacity utilization fell 1.7 percent year-over-year to 75.6 percent – an 11-month high.
Homebuilder optimism inched up a point month-over-month in February to 84. A fresh high of 90 was posted last November.
Housing starts (February) are due out on Wednesday. January starts dropped six percent m/m to 1.58 million units (SAAR). Last December’s 1.68 million was the highest since July 2006.
WTI crude oil: Currently net long 567.4k, up 18k.
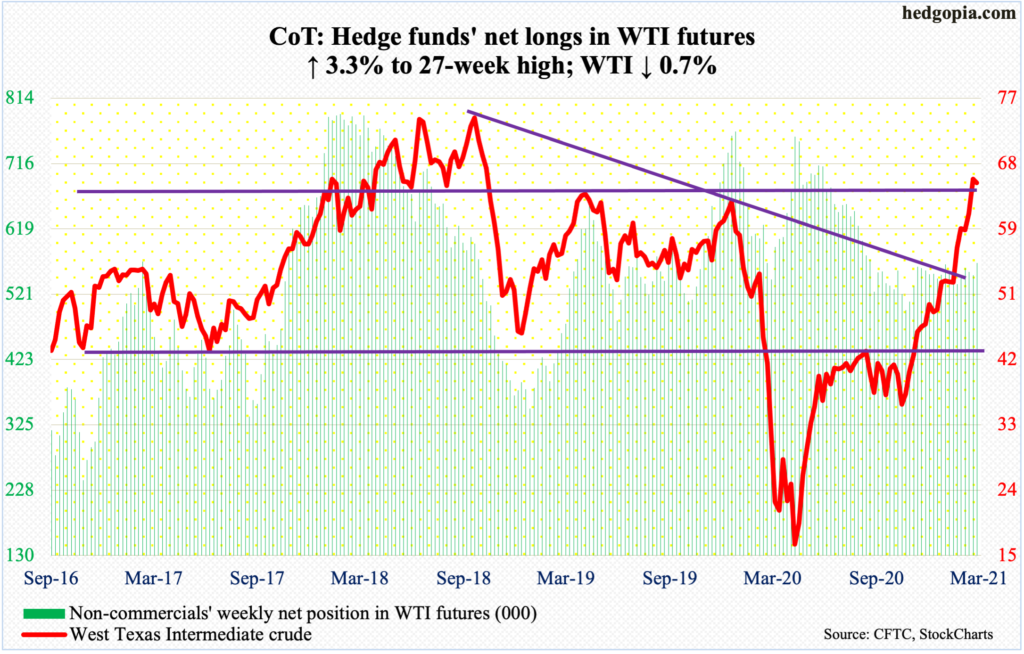
Last week, oil bulls defended the 20-day moving average. This week, there were bids ready at the 10-day. Before this, WTI ($65.61/barrel) retreated after posting $67.98 on Monday. This was the highest price since October 2018.
The crude has come a long way, having bottomed at $6.50 last April. This was then followed by a crucial breakout at $41-$42 in November and then another just north of $52 early February.
This week, it traded within a wide range of $67.98 and $63.13, resulting in a weekly spinning top. This is worth watching. The weekly in particular could be itching to unwind its grossly overbought conditions. A loss of $62 could open the door to a test of the 50-day at $56.92.
In the meantime, per the weekly EIA report, US crude production in the week to March 5 rose 900,000 barrels/day to 10.9 million b/d. Crude stocks, too, increased – up 13.8 million barrels to 498.4 million barrels. Gasoline and distillate stocks, however, declined 11.9 million barrels and 5.5 million barrels to 231.6 million barrels and 137.5 million barrels respectively. Crude imports dropped 637,000 b/d to 5.7 mb/d. Refinery utilization rose 13 percentage points to 69 percent.
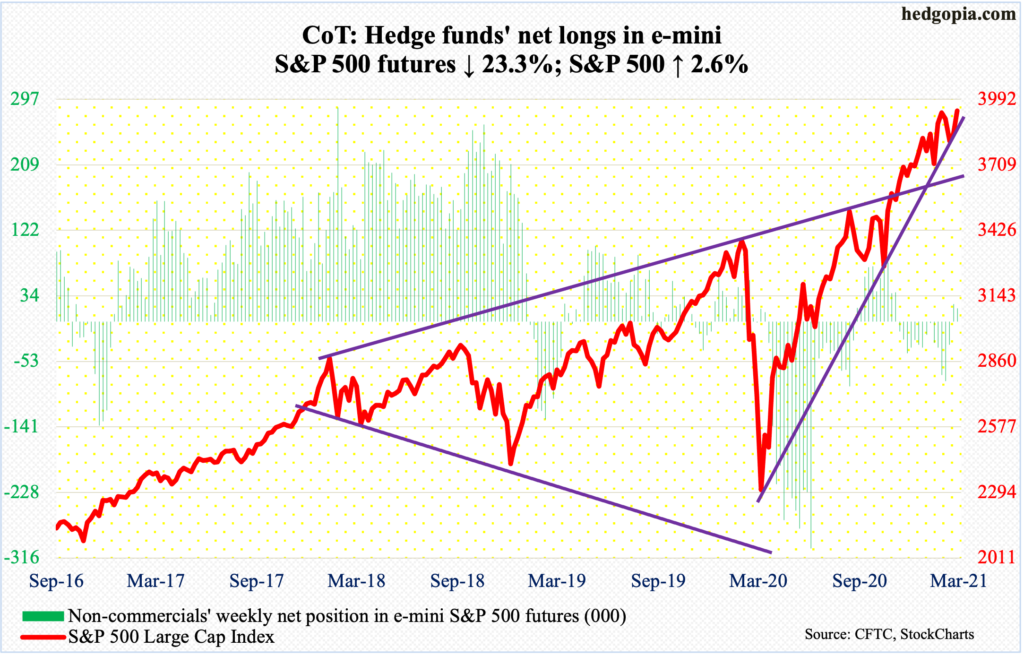
E-mini S&P 500: Currently net long 17.8k, down 5.4k.
Reversing the prior week’s tiny inflows of $329 million, US-based equity funds in the week to Wednesday pulled in $14.8 billion (courtesy of Lipper). This brings the five-week total to $67.7 billion. In those five weeks, SPY (SPDR S&P 500 ETF), VOO (Vanguard S&P 500 ETF) and IVV (iShares Core S&P 500 ETF) collectively gained $28.7 billion, including $1.8 billion in the week to Wednesday (courtesy of ETF.com).
Bulls should like the fact that the latest week’s flows took advantage of the weakness in the S&P 500, which dropped 5.7 percent in 13 sessions intraday. The dip was bought (more on this here). Last Thursday’s low of 3723.34 was posted right before Friday’s hammer reversal. This week, the large cap index (3943.34) reclaimed the 50-day and by Thursday a new intraday high of 3960.27 was posted.
This week’s 2.6-percent rally followed last week’s defense of a rising trend line from last March (although it was breached intraday). Bulls have an opportunity here to force another breakout at 3950s, which should clear the way for the big round number – 4000.
With 13 sessions to go before 1Q is done, the S&P 500 is up five percent. In all probability, US households’ equity allocation rose further into uncharted territory. They already ended 2020 with a record 34.4 percent allocation (chart here).
Euro: Currently net long 102k, down 24k.
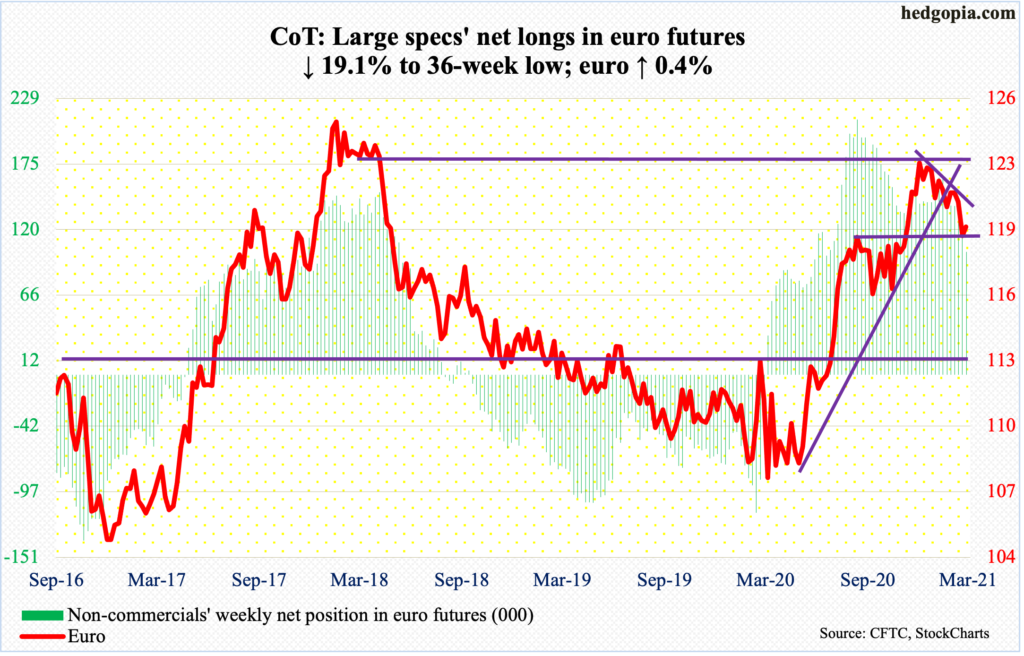
In order to dampen the recent increase in long rates, the ECB plans to significantly increase its bond purchases next quarter. There already is a €1.85-trillion Pandemic Emergency Purchase Program in place, set to expire in March 2022. The pace of purchases so far this quarter has slowed down, which it now plans to ramp up. The attempt of course is to try to calm bond-market nerves, which, among other things, are sensing higher growth. The ECB itself on Thursday revised its 2020 eurozone GDP growth forecast higher from 3.9 percent last December to four percent. Yet, it continues to print. The balance sheet has ballooned to €7.1 trillion, up from €4.7 trillion a year ago.
Ahead of this, the euro ($1.1954) bottomed on Monday at $1.1843 – just above the 200-day at $1.1813. Earlier on January 6, it retreated after tagging $1.2345. On Thursday, the currency – oversold – ignored the ECB pronouncement and rallied 0.6 percent to $1.1992.
Resistance at $1.20-$1.21 goes back more than 17 years.
Gold: Currently net long 175.2k, down 14.5k.
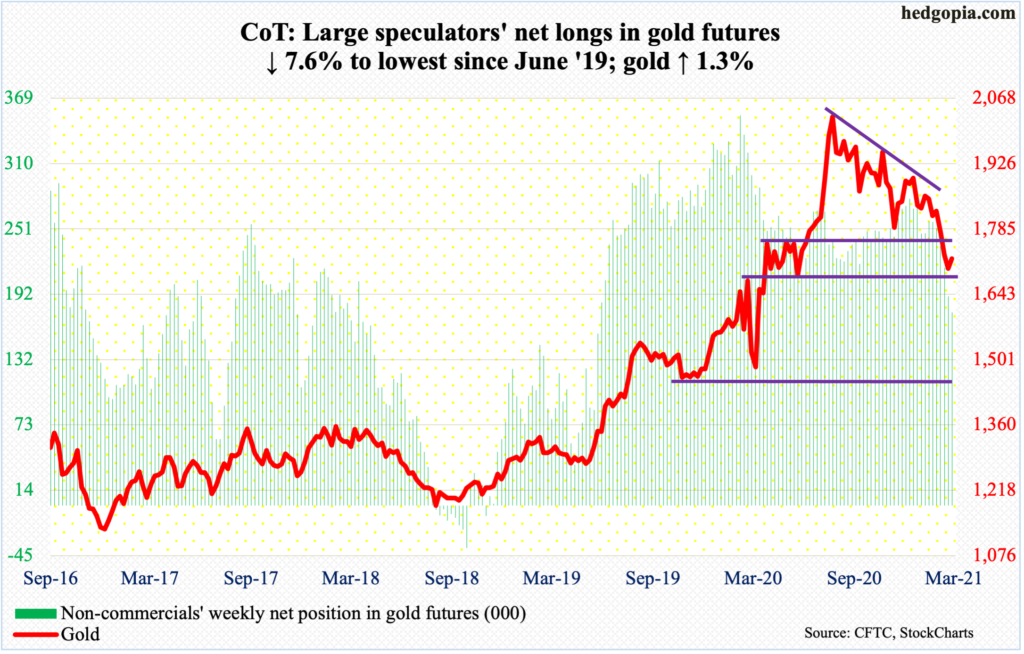
GLD (SPDR Gold ETF) began to suffer outflows on a sustained basis in the week to October 21 last year. In the 21 weeks since, 18 saw outflows, for a cumulative loss of $12.6 billion, including $1.2 billion in the week to Wednesday (courtesy of ETF.com).
As they say, lower prices bring out sellers. Gold ($1,719.80/ounce) reached its all-time high of $2,089.20 on August 7 last year before coming under pressure, trading within a descending triangle, which it fell out of two Fridays ago. All along, the metal struggled to recapture $1,920s, which was the prior high from September 2011.
Amidst this, several monthly indicators have reached the median from above. If gold bugs want to make their presence felt, this is the place. So far so good. For the second week running, bids showed up at/near horizontal support at $1,670s, with a weekly spinning top to boot.
Above, resistance lies at $1,760s-$1,770s.
Nasdaq 100 index (mini): Currently net short 12.5k, down 11k.
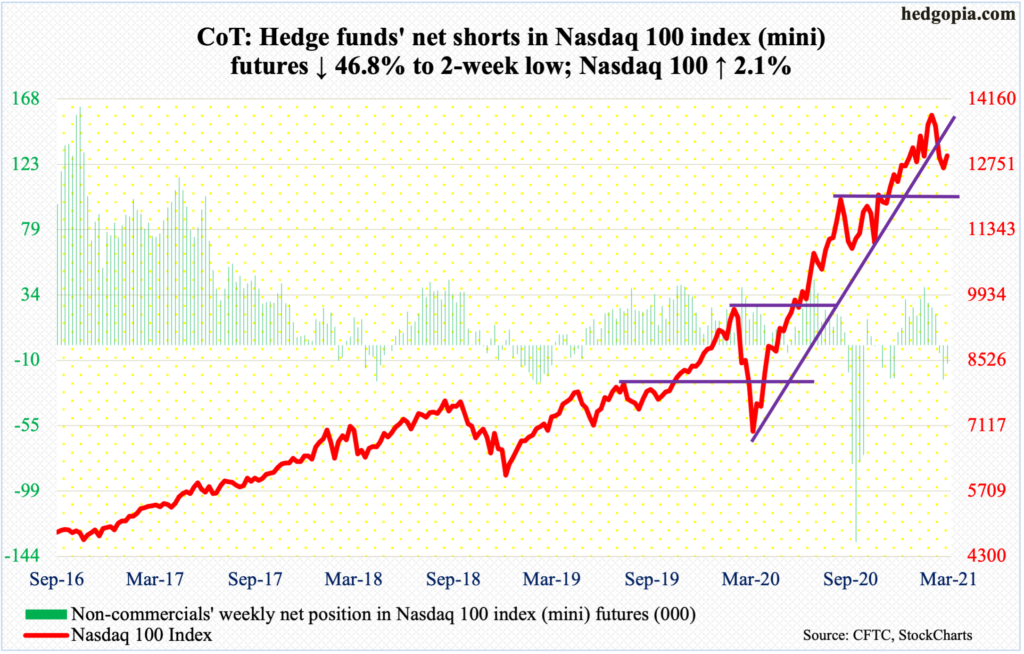
Tech bulls made good use of last Friday’s hammer reversal. This week, the Nasdaq 100 rallied 2.1 percent. Thursday’s high of 13117.86 just about tested the 50-day (13152.87).
It is possible this week’s strength – although subdued compared to how both small- and large-caps fared – was aided by short-covering. Nasdaq short interest remains elevated (more on this here), even as short interest on QQQ (Invesco QQQ Trust) shot up 24.2 percent in the second half of February (chart here).
On the Nasdaq 100 (12937.29), there is a gap from February 22, which will be filled at 13500. This is about where the underside of the broken March ’20 trend line lies as well. Odds favor this resistance holds, if it gets to be tested at all.
With two weeks in, March so far is up 0.2 percent, with a candle that looks like a hanging man. Before this, February produced a monthly shooting star and January a long-legged doji.
Russell 2000 mini-index: Currently net long 4.7k, up 19.4k.
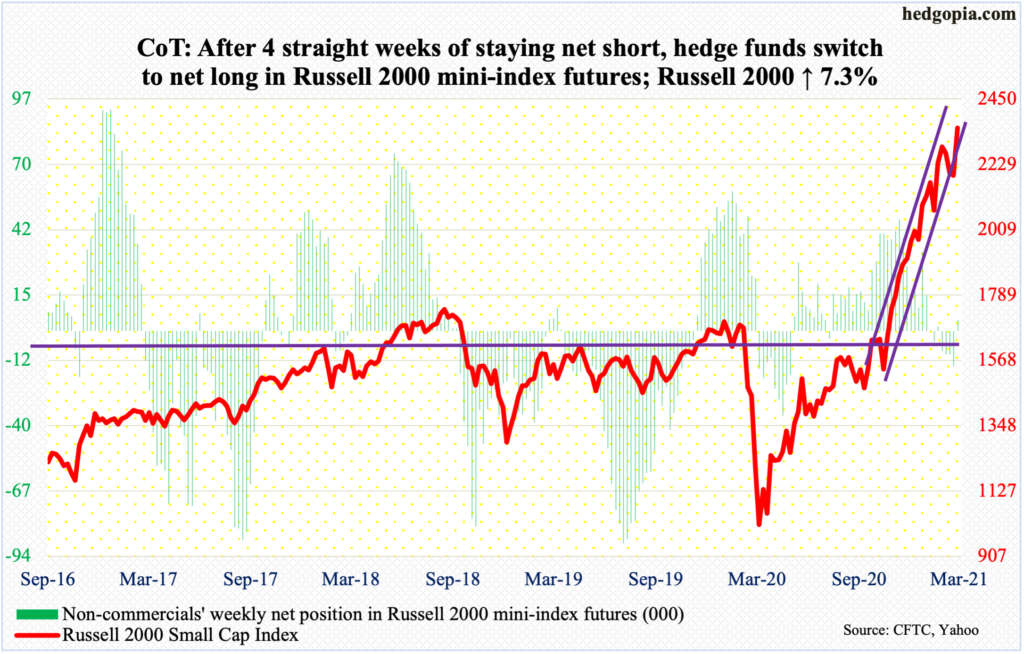
On the heels of last Friday’s hammer reversal, the Russel 2000 rallied in all five sessions this week, reaching a new intraday high of 2354.20 on Friday, edging past the prior high of 2318.09 from February 10.
With this, the small cap index (2352.79) rallied back into the ascending channel from late October-early November last year which was breached last week. Looks like a case of a false breakdown. Time will tell.
For now, small-caps bulls have carved out decent horizontal support at 2070s-2080s.
US Dollar Index: Currently net short 8.9k, down 1.2k.
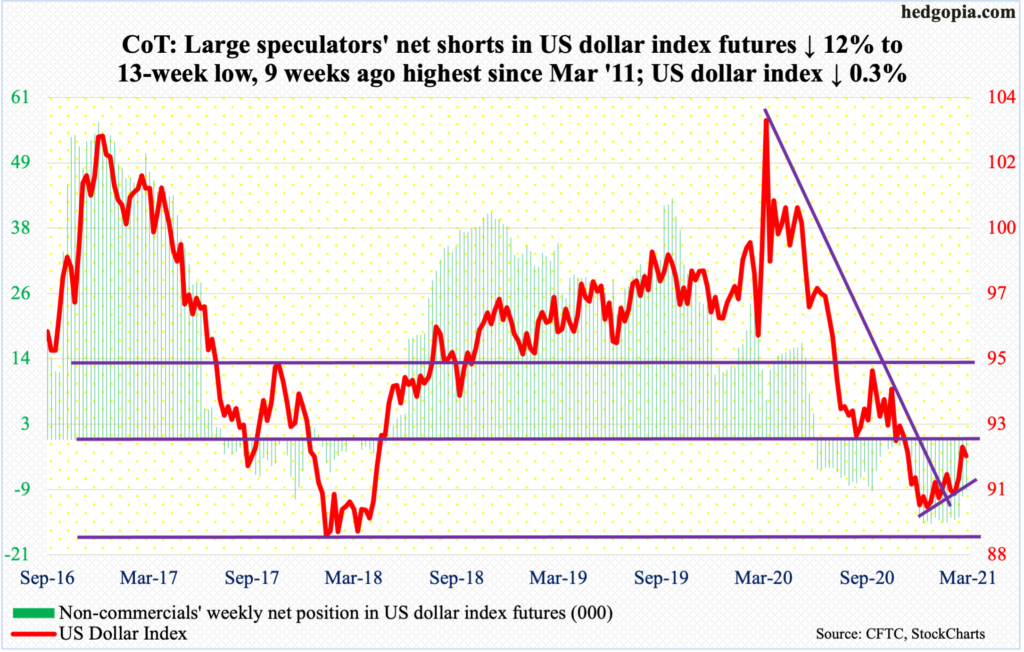
Dollar bulls kept up the pressure early this week but the momentum proved transient. On Tuesday, the US Dollar Index tagged 92.53 intraday but only to meet with sell orders, closing the session at 91.96. There is major resistance at 92 – or just north of it – which was lost last November.
The most recent rally followed a successful test in January of 88-89, which goes back to at least March 2004; the US Dollar Index (91.68) bottomed on January 6 at 89.17.
Thursday’s rejection could prove to be important. Immediately ahead, there is support at 90-91, with the 50-day at 90.63.
VIX: Currently net short 130.4k, down 8.6k.
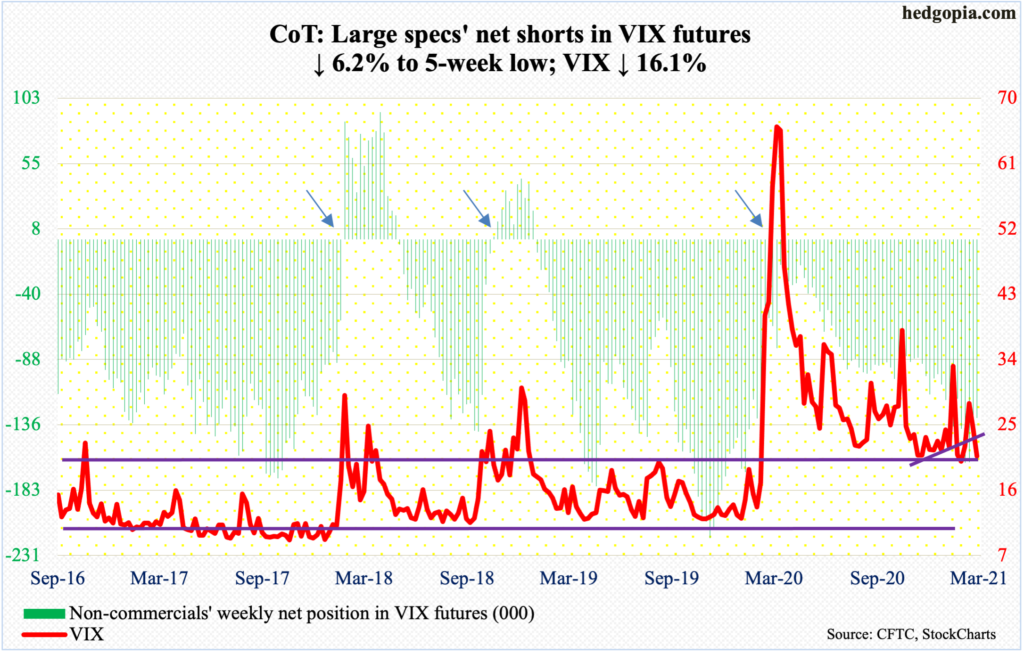
Last Thursday’s intraday high of 31.90 turned out to be yet another lower high in a series of lower highs since VIX (20.69) tagged 85.47 intraday last March. By Tuesday this week, the 200-day was lost, followed by a breach of the 50-day in the very next session.
A loss of mid-20s quickly led to a test of low-20s, with Friday tagging 20.63 intraday. Volatility bulls have doggedly defended this support since last August.


