
CoT: Peeking Into The Future Thru Futures And Hedge Fund Buying This Week
Following futures positions of non-commercials are as of February 16, 2021.
10-year note: Currently net long 103.4k, up 23.9k.
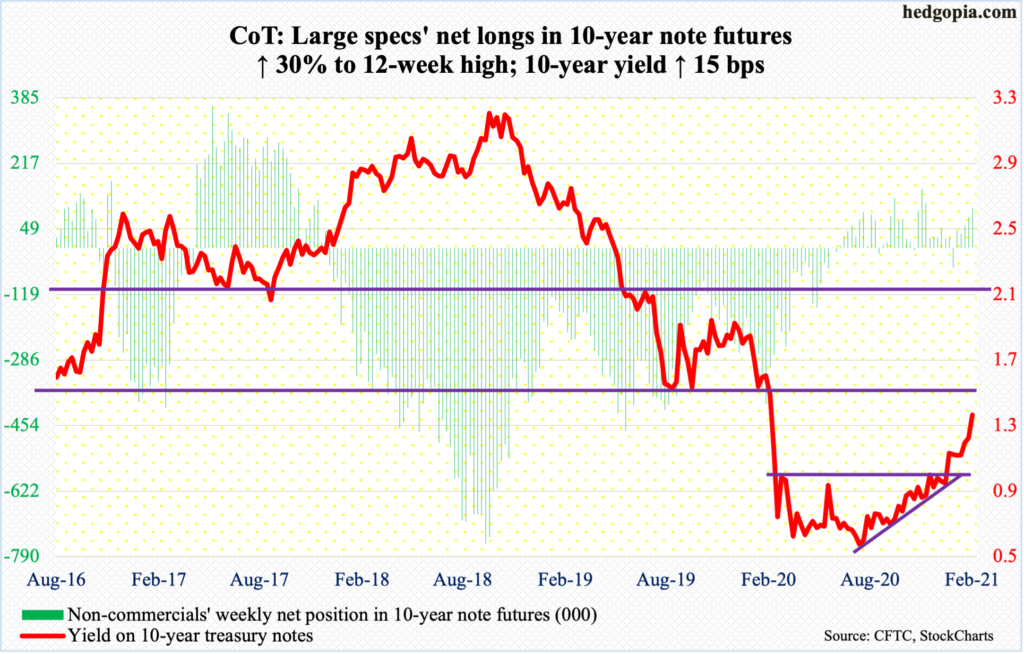
The 10-year treasury yield had a mini breakout this week at 1.2 percent. This was preceded by a breakout six weeks ago at one percent. Rates had been making higher lows since last March when they bottomed at 0.4 percent, and particularly since August.
Nearest resistance lies at 1.4 percent, or between 1.4 percent and 1.5 percent. Friday, the 10-year (1.35 percent) rallied as high as 1.36 percent intraday.
The Fed must be watching this with keen interest. It has said it would purchase up to $120 billion/month in mortgage-backed securities and treasury notes and bonds. As of Wednesday, it held $6.3 trillion in these securities, up from $3.4 trillion last March, and is on pace to owning $7.6 trillion by year-end (more on this here).
Yet, the 10-year yield has a spring in its step. Foreigners have been aggressively reducing exposure to treasury notes and bonds. Last year, they cut holdings by $540 billion, yet this paled in comparison to the Fed’s purchases, which went up by $2 trillion.
With economic data beginning to turn and consumers flush with cash, unless foreigners do a quick U-turn, the Fed may have to significantly raise its pace of purchases in months to come. Else, higher rates begin to persist, and that will be a problem in a leveraged economy.
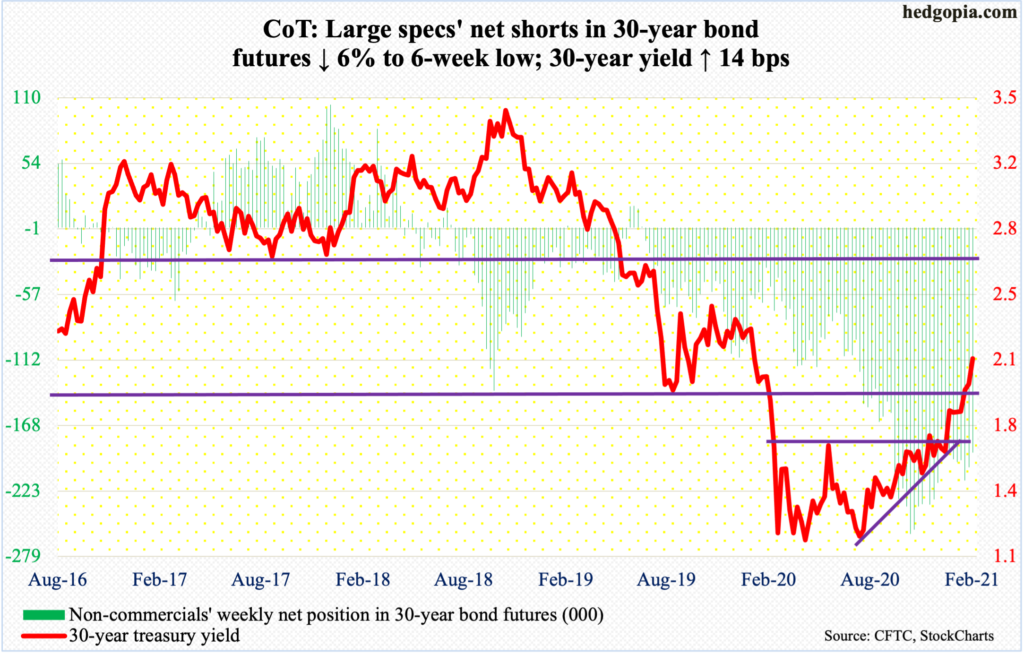
30-year bond: Currently net short 191k, down 12.2k.
Major economic releases for next week are as follows.
The S&P Case-Shiller Home Price Index (December) is scheduled for Tuesday. Nationally, home prices in November jumped 9.5 percent year-over-year, which was the steepest y/y appreciation since February 2014.
New home sales (January) are due out Wednesday. December sales were up 1.6 percent month-over-month to a seasonally adjusted annual rate of 842,000 units. Earlier in July, sales reached 979,000 units – the highest since December 2006.
Thursday brings GDP (4Q20, 2nd print), corporate profits (4Q20) and durable goods orders (January).
The advance estimate showed real GDP grew four percent in 4Q20. This followed a 33.4-percent surge in 3Q. Before that, the economy contracted five percent in 1Q and 31.4 percent in 2Q.
Corporate profits adjusted for inventory valuation and capital consumption shot up 27.4 percent in 3Q20 to $2.33 trillion (SAAR) – a new record. This preceded contractions of 12 percent in 1Q and 10.3 percent in 2Q.
Orders for non-defense capital goods ex-aircraft – proxy for business capex plans – shot up 8.7 percent y/y in December to $72 billion (SAAR) – a record.
Personal income/spending (January) and the University of Michigan’s Consumer Sentiment Index (February, final) come out Friday.
In the 12 months to December, core PCE, which is the Fed’s favorite measure of consumer inflation, rose 1.45 percent. The last time this metric grew with a two handle was in December 2018.
February’s preliminary reading showed consumer sentiment dropped 2.8 points m/m to 76.2 – a six-month low.
WTI crude oil: Currently net long 559.9k, up 10.7k.
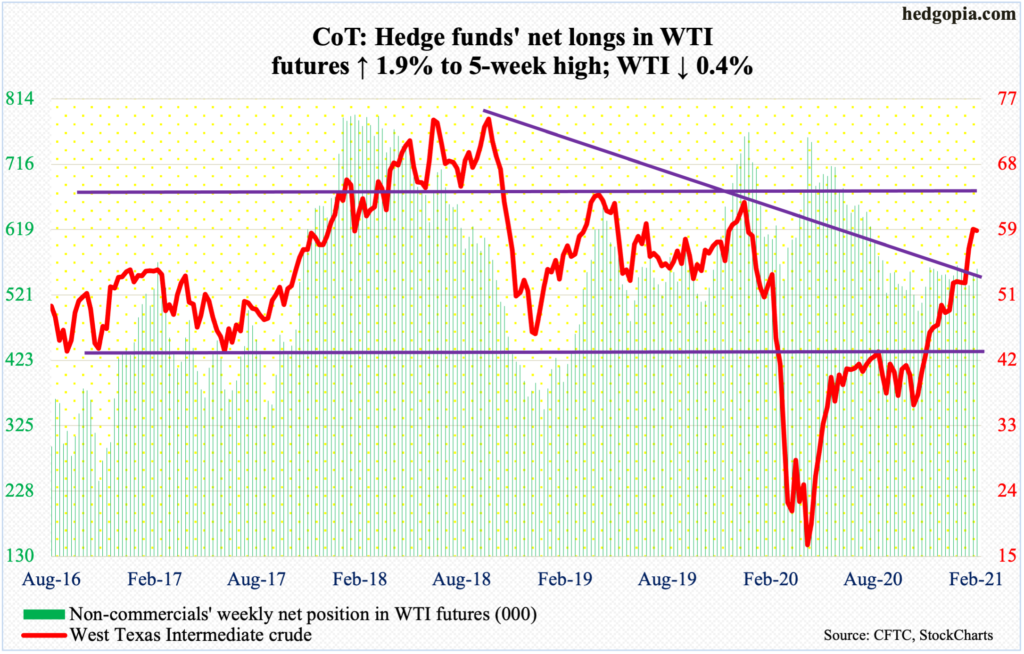
WTI ($59.26/barrel) tagged $62.29 intraday Thursday before reversing lower one percent. This preceded a rally in 11 out of 12 sessions. On its way here, the crude two weeks ago broke out of a falling trend line from October 2018 when it retreated after posting $76.90. A bigger test lied ahead – trend-line resistance from July 2008 when the crude reached an all-time high of $147.27. This was tested this week, and bears stood their ground. Given the immense importance of this resistance, it is unlikely it gives way this easy.
WTI remains extremely overbought on the daily and weekly in particular. Nearest support lies at $59, followed by $52-$54. The 50-day moving average is at $52.19.
In the week to February 12, EIA data shows US crude production fell 200,000 barrels per day to 10.8 million b/d. The data is a week old, hence does not quite reflect the drop in production due to the freeze in Texas. This is one reason why WTI continued to attract bids anyway; but at some point this will have been priced in. In the same week, crude and distillate stocks declined 7.3 million barrels and 3.4 million barrels to 461.8 million barrels and 157.7 million barrels respectively. Refinery utilization inched up one-tenth of a percentage point to 83.1 percent. Gasoline stocks, on the other hand, rose 672,000 barrels to 257.1 million barrels. As did crude imports, which increased 41,000 b/d to 5.9 mb/d.
E-mini S&P 500: Currently net short 79.9k, up 8.4k.
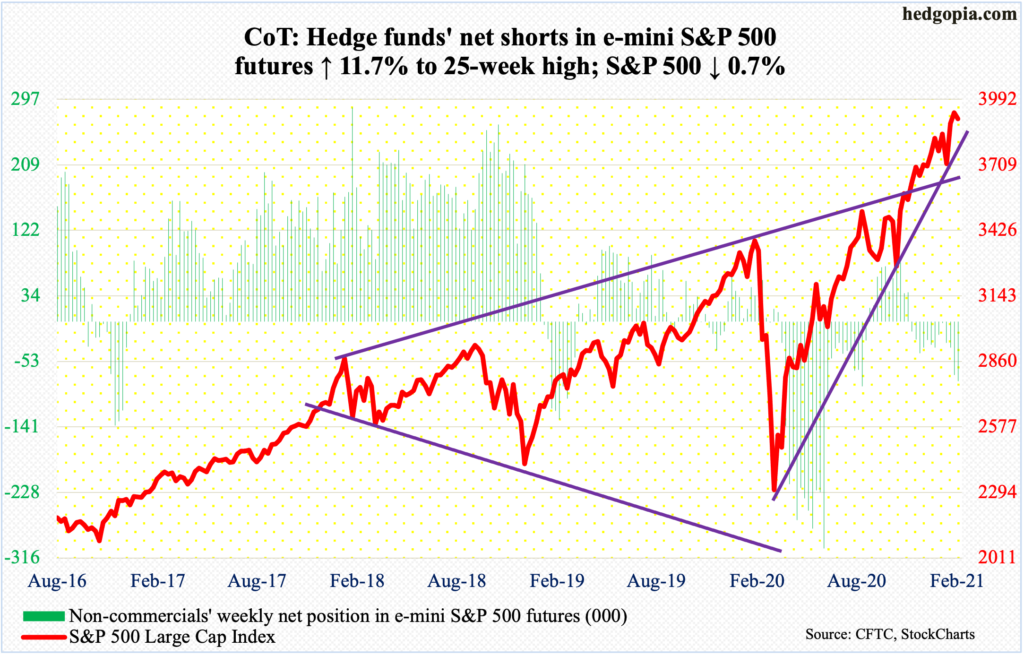
Flows continued to cooperate. After taking in $25.9 billion in the prior week, another $9.6 billion moved into US-based equity funds in the week to Wednesday (courtesy of Lipper). In the same week, SPY (SPDR S&P 500 ETF), VOO (Vanguard S&P 500 ETF) and IVV (iShares Core S&P 500 ETF) collectively took in $4.1 billion; this followed inflows of $20.6 billion in the prior week (courtesy of ETF.com).
Despite these flows, bulls were on the defensive this week. The holiday-shortened week started out as posting a new intraday high of 3950.43 on Tuesday but bulls were unable to hang on to it, dropping in the next three sessions, albeit slightly. For the week, the S&P 500 was down 0.7 percent.
There was not much damage done to the upward momentum. The large cap index (3906.71) remains above shorter-term averages, and perhaps importantly, short-term straight-line support at 3870s, which was just about tested Thursday when 3885.03 was tagged intraday. A break of 3870s can swing momentum to bears’ favor near term. More importantly, around 3800 lies a rising trend line from last March, which was vigorously defended early this month.
Euro: Currently net long 140k, down 216.
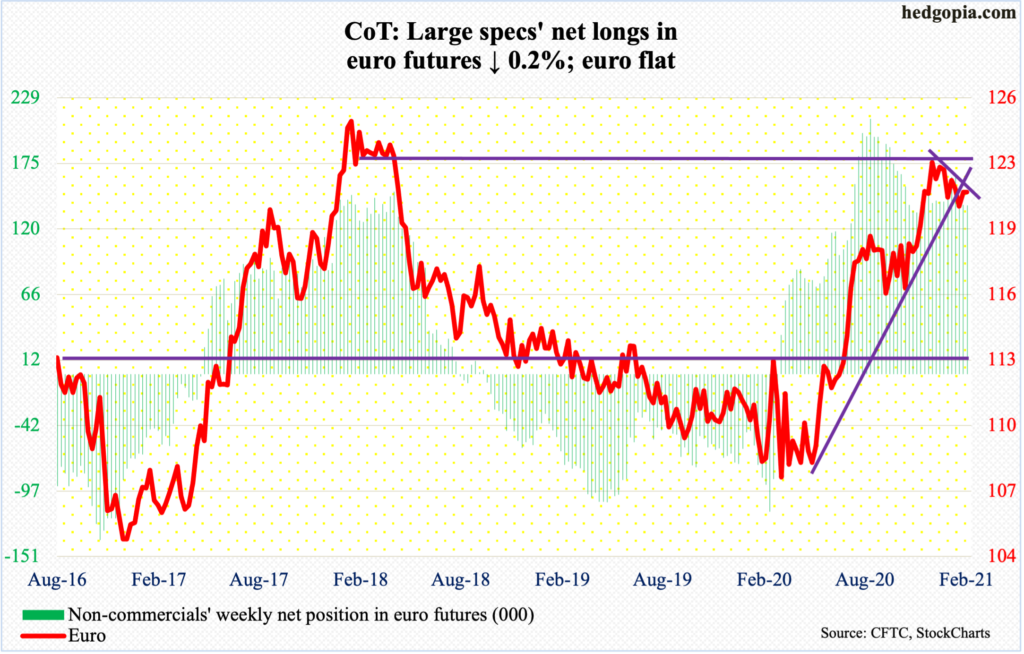
The 50-day ($1.2154) continued to pose problems for euro bulls. Last Thursday, the average was just about tested before bears showed up. On Tuesday this week, this occurred again, as the euro ($1.2119) reversed lower after tagging $1.2152. This is also an area where the $1.20-$1.21 level, which goes back more than 17 years and which the bulls reclaimed in early December, continues to generate interest for both bulls and bears.
As things stand, the currency is in no man’s land, with risks evenly split between upside and downside.
Gold: Currently net long 235k, down 16.4k.
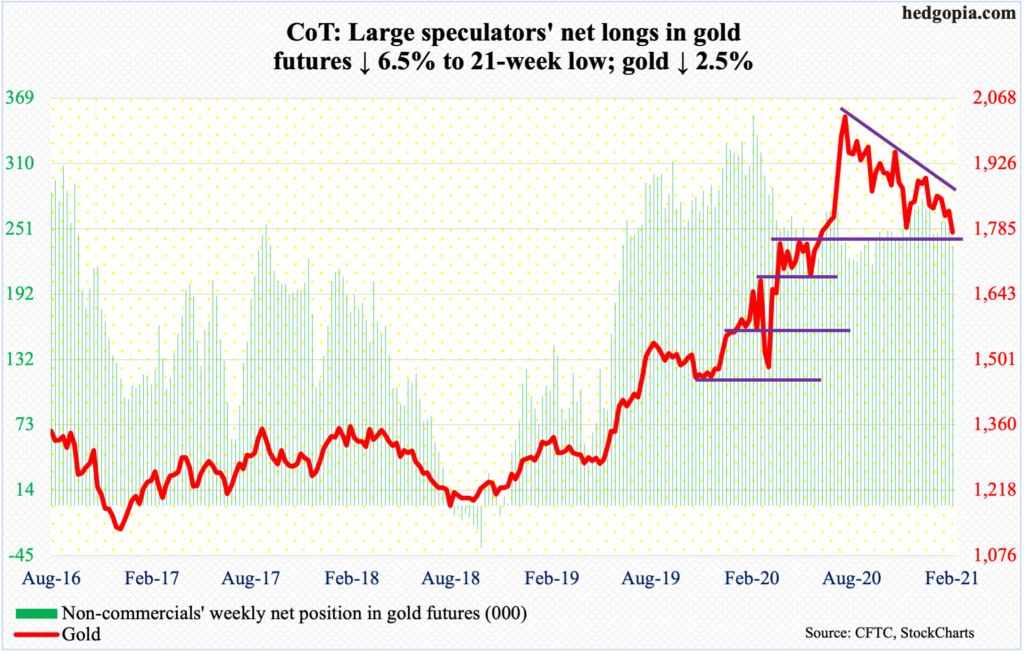
Gold ($1,777.40/ounce) tested crucial support at $1,760s-$1,770s – so far successfully. On both Wednesday and Thursday, the metal dropped into $1,760s before drawing some bids, with the latter a long-legged doji session. This was followed by another indecisive spinning top session on Friday when it hit $1,759 intraday.
The yellow metal reached its all-time high of $2,089.20 on August 7, and currently finds itself within a potentially bearish descending triangle, the lower support of which lies at $1,760s-$1,770s.
A relief is possible. The daily is getting oversold. In the event a rally ensues, there is dual resistance at $1,830s – horizontal and the aforementioned trend line. In due course, risks are rising $1760s-$1,770s breaks.
Non-commercials reduced net longs in gold futures to a 21-week low.
Nasdaq 100 index (mini): Currently net long 21.1k, down 4.6k.
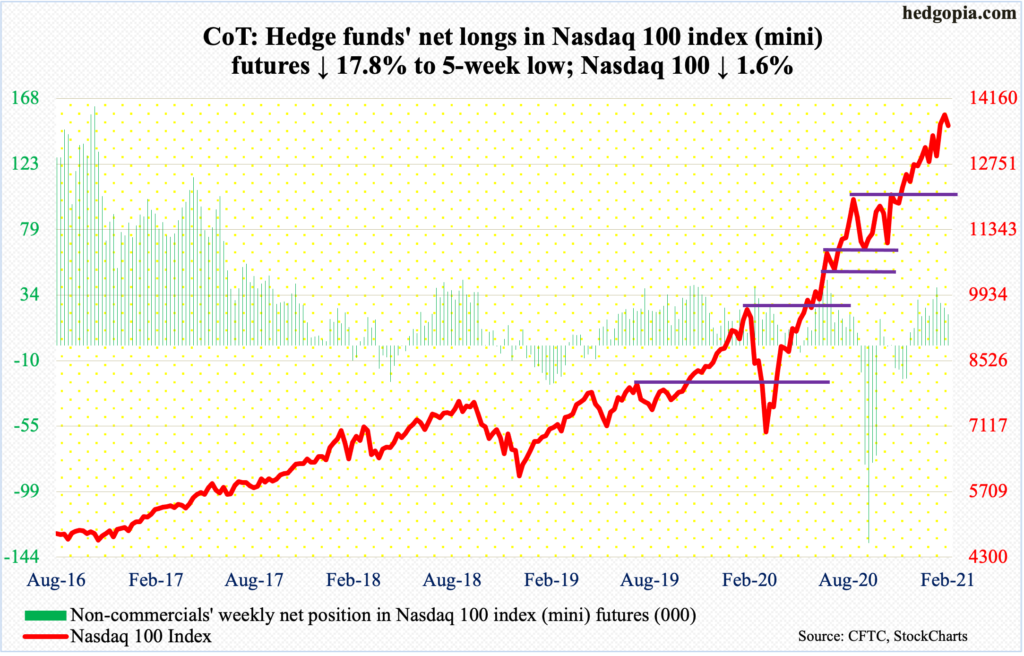
On Tuesday, the Nasdaq 100 posted a new intraday high of 13879.77 before retreating. On both Wednesday and Thursday, short-term straight-line support at 13560s was defended, with the index (13580.78) closing out the week essentially right on it.
The real test lies at 13400, which is where a rising trend line from last March lies. At the end of January, the tech-heavy index ended right on that trend line, which was zealously defended. They cannot afford to lose this one.
Russell 2000 mini-index: Currently net short 9.8k, up 1.4k.
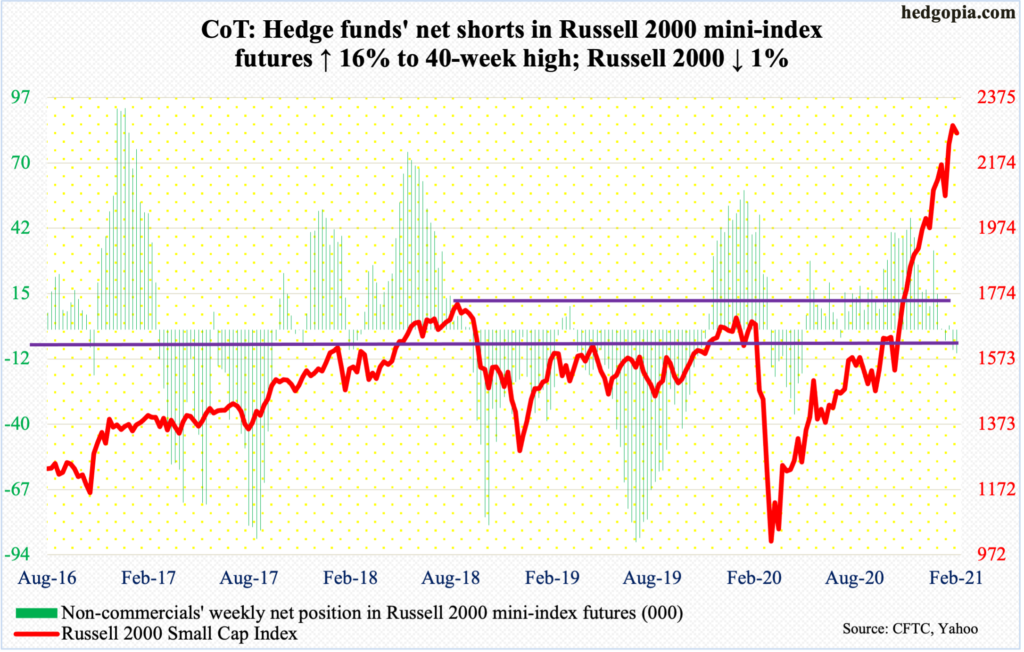
Last Wednesday’s intraday all-time high of 2318.09 was rejected at the upper bound of a rising channel from late October-early November. At the end of January, the Russell 2000 landed right on the bottom end of the channel, which was defended.
Once again, the small cap index (2266.69) is trying to bounce off of the lower bound. At Thursday’s intraday low of 2208.49, the support was just about tested; Friday, it jumped 2.2 percent. As long as this channel is intact, momentum remains with the bulls.
US Dollar Index: Currently net short 14.3k, up 412.
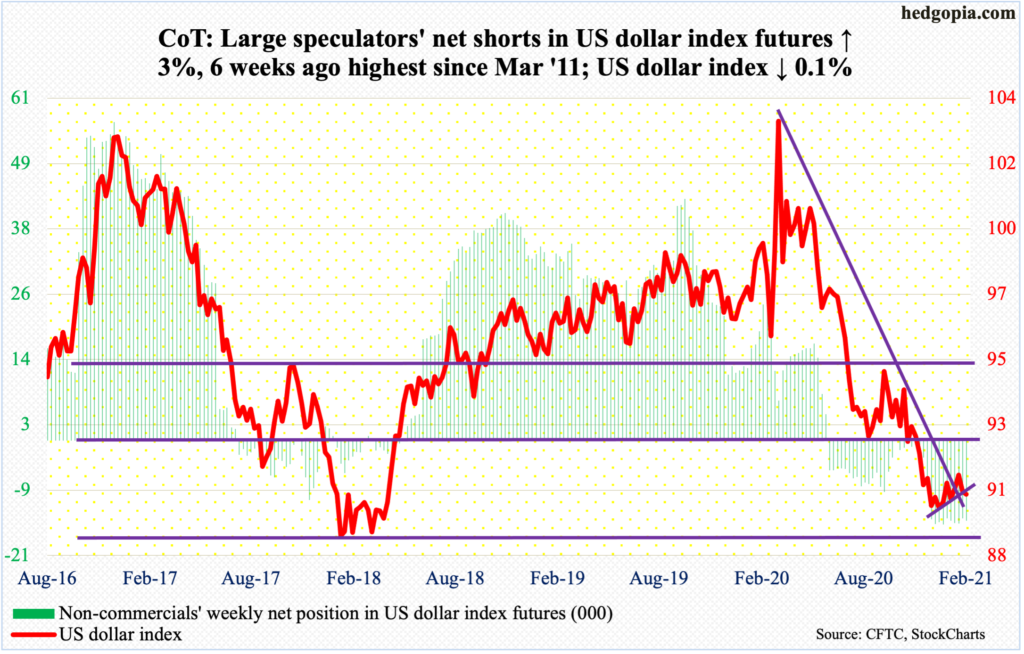
Dollar bulls this week once again stepped up in defense of 90, a loss of which would open the door to a test of 88-89, which goes back to at least March 2004. Earlier on January 6 (this year), the US Dollar Index (90.36) bottomed at 89.17.
It is important this support holds. Two weeks ago, the index broke out of a falling trend line from last March when it peaked at 103.96, but has been unable to build on it, trending lower along that line, hence the significance of 90.
VIX: Currently net short 163.2k, up 24.9k.
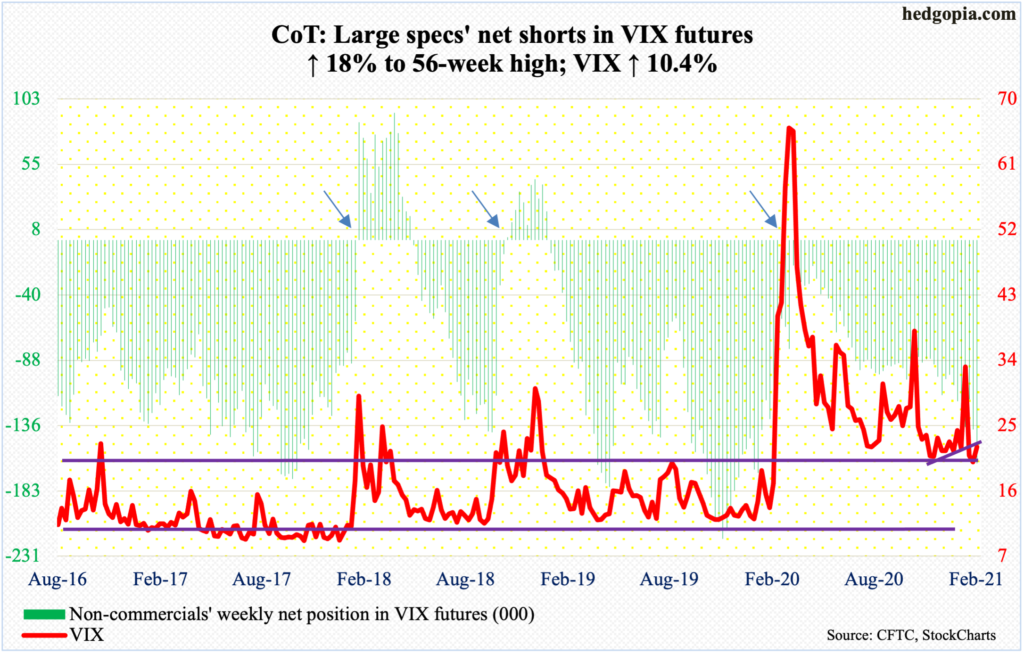
On the monthly, several indicators such as the RSI have reached the median and can swing higher. The odds of this happening looked slim last week as VIX looked to be on the verge of a breakdown, heading toward mid- to high-teens near term, although the volatility curve foreshadowed a rally medium term (more on this here).
But, as soon as the week opened, VIX (22.05) began to show some strength, although rallies were cut short, with long upper shadows in each of the three sessions through Thursday. For the week, the volatility index was up 2.08 points, or 10.4 percent.
Momentum should shift bulls’ way once the 50-day, which at 23.50 is flat as a pancake, and mid-20s resistance give way.


