
CoT: Peek Into Future Through Futures; How Hedge Funds Are Positioned
Following futures positions of non-commercials are as of October 1, 2019.
10-year note: Currently net short 163.6k, down 32.7k.
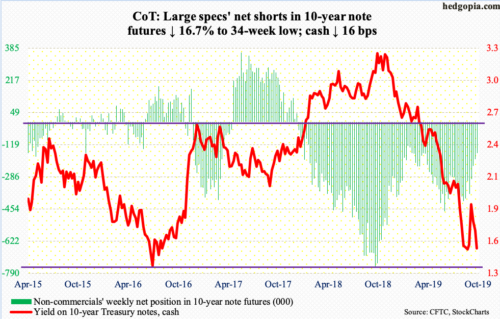
Futures traders this week reacted to September’s ISM reports by jacking up the probability of a 25-basis-point cut later this month to 76 percent. On Thursday, this was north of 90 percent. The Fed eased the fed funds rate in July and September by 25 basis points each to a range of 175 to 200 basis points. The 10-year Treasury yield (1.52 percent) lost 16 basis points this week.
Both ISM manufacturing and non-manufacturing reports – out Wednesday and Thursday – kind of spooked the markets. Manufacturing activity fell 1.3 points month-over-month in September to 47.8 – the lowest since June 2009. This was the first back-to-back sub-50 reading since February 2016. Services activity dropped 3.8 points m/m to 52.6 – a 37-month low.
One month does not make a trend, but the rather large decrease in services activity probably forced many to rethink their nonchalant attitude. Manufacturing weakness is not new. The conventional thinking is that it is yet to seep into services. September’s weak report raises that possibility. One or two more weak reports will have significantly increased the odds. Markets are still hoping that in the end it will be a repeat of 2015-2016 when US economic activity softened but not to a point of contraction. Real GDP decelerated to 0.1 percent growth in 4Q15. If the economy continues to surprise to the downside, then it is just a matter of time before asset prices get rerated, not the least of which are equities.
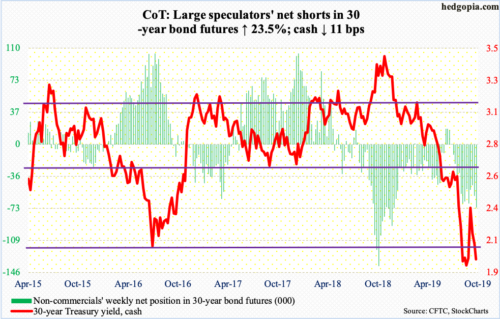
30-year bond: Currently net short 43k, up 1.1k.
Major economic releases next week are as follows.
The NFIB optimism index (September) and the producer price index (September) come out Tuesday.
Small-business optimism in August fell 1.6 points month-over-month to 103.1. This was the 32nd consecutive week of 100-plus reading, including the all-time high of 108.8 in August last year.
August headline and core producer prices respectively rose 0.1 percent and 0.4 percent m/m. In the 12 months to August, they respectively advanced 1.8 percent and 1.9 percent.
JOLTS job openings (August) and FOMC minutes (September 17-18 meeting) are due out Wednesday.
Non-farm job openings dropped 31,000 m/m in July to 7.22 million. Openings reached a record 7.63 million last November.
The consumer price index (September) is on tap Thursday. CPI and core CPI rose 0.1 percent and 0.3 percent m/m in August, in that order. In the 12 months to August, they respectively rose 1.8 percent and 2.4 percent.
The University of Michigan consumer sentiment index (October, preliminary) is scheduled for Friday. Sentiment rose 3.4 points m/m in September to 93.2. Except for August’s 89.8, sentiment has been north of 90 since November 2016 – four of them over 100.
WTI crude oil: Currently net long 546.5k, down 44.1k.
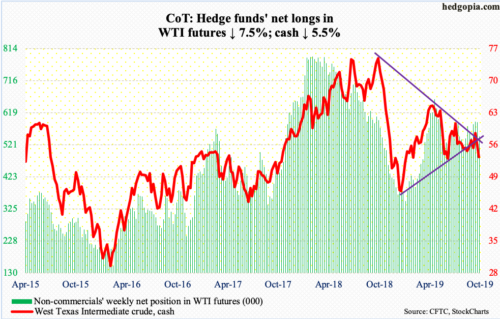
The cash ($52.81/barrel) fell out of a one-year wedge this week. It is now below both the 50- and 200-day ($55.74 and $56.57, respectively). Amidst this, bids showed up Thursday at $50-51, which bulls defended in both June and August. The daily is oversold. Besides the moving averages, the underside of the broken trend line from last December lies at $56.
The EIA report for the week of September 27 showed that crude stocks rose 3.1 million barrels to 422.6 million barrels. Refinery utilization dropped 3.4 percentage points to 86.4 percent. Stocks of gasoline and distillates declined 228,000 barrels and 2.4 million barrels to 230 million barrels and 131.3 million barrels, in that order. Crude imports dropped 87,000 barrels per day to 6.3 million bpd. Crude production declined 100,000 bpd to 12.4 mbpd.
E-mini S&P 500: Currently net long 9.4k, up 3.9k.
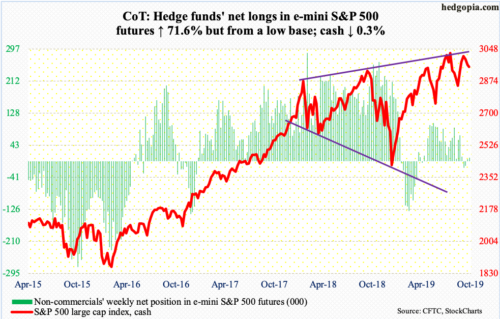
After two down weeks, the cash (2952.01) continued to come under pressure this week, losing 0.3 percent. In fact, by intraday Thursday, it was down as much as 3.6 percent, but bids showed up to end the session with a hammer. Friday, the 50-day as well as 2940s were recaptured. There is room for the daily to continue to push higher.
The Thursday low of 2855.94 did not quite test important support just north of 2800. It also came up short of testing the 200-day (2841.26). At the same time, this can also be treated positively as a higher low. Several times in August, bids appeared in 2820s-30s. Back then, rallies repeatedly got stopped at the 50-day/2940s. This time around, bulls hurriedly reclaimed these levels. Now, they will need flows to cooperate.
In the week to Wednesday, US-based equity funds lost $7.9 billion (courtesy of Lipper). In the same week, SPY (SPDR S&P 500 ETF), VOO (Vanguard S&P 500 ETF) and IVV (iShares Core S&P 500 ETF) gained a combined $396 million; this follows $12.1 billion in inflows in the prior three (courtesy of ETF.com).
Euro: Currently net short 66k, up 5.3k.
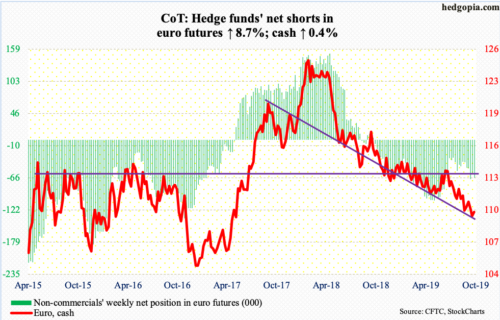
Yet another low in the cash ($109.79). Both Monday and Tuesday, the euro made an intraday low of $108.85, which was the lowest since May 2017. Rally attempts on both Thursday and Friday got stopped at the 20-day ($109.98), which approximates horizontal resistance just north of $110. The daily has room to rally. The 50-day, which is still declining, lies at $110.65.
Gold: Currently net long 269k, down 43.5k.
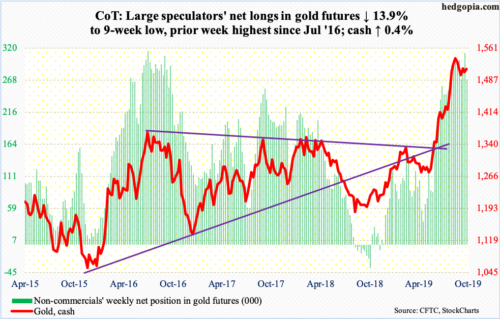
The cash ($1,512.90/ounce) began the week with a loss of the 50-day ($1,507.13) but recovered after dropping to $1,465 intraday Tuesday. This was nearly a successful breakout retest of $1,440s-50s, which gold broke out of early August.
This gives gold bugs something to potentially build on. Immediately ahead, there is trend-line resistance from September 4 around $1,530. That was when the metal tagged $1,566.20 intraday, before turning lower. In September 2011, gold peaked at record $1,923.70 and began to unravel after it lost $1,540s-50s. This level is worth watching. Thursday, the metal retreated after tagging $1,525.80.
After pulling in $2 billion in the prior week, GLD (SPDR Gold ETF) lost $59 million in the week to Wednesday, although IAU (iShares Gold Trust) took in $304 million (courtesy of ETF.com). Gold began to rally late May. Since then, $11 billion has moved into these two ETFs. The prevailing optimism is also reflected in non-commercials’ holdings, which in the prior week stood at the highest since July 2016.
Nasdaq 100 index (mini): Currently net long 26.8k, up 13k.
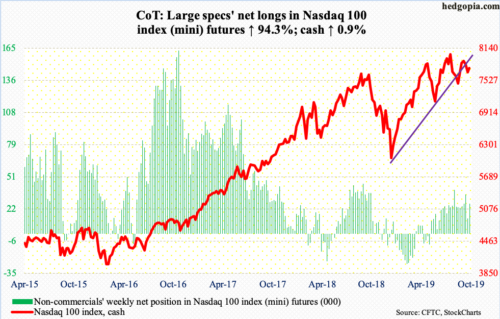
After attracting $2.2 billion in the prior five weeks, QQQ (Invesco QQQ Trust) lost $1.8 billion in the week to Wednesday (courtesy of ETF.com). This followed two down weeks in the cash (7754.10). This week, it rose 0.9 percent – quite a reversal given it was down as much as 2.8 percent by intraday Thursday.
In the process, the 50-day (7726.97) was lost and then reclaimed. Thursday’s hammer reversal strengthens bulls’ case for now. They need to also recapture the now-broken trend line from last December, the underside of which lies around 7750, which is about where it closed Friday.
Russell 2000 mini-index: Currently net short 23.4k, down 7.9k.
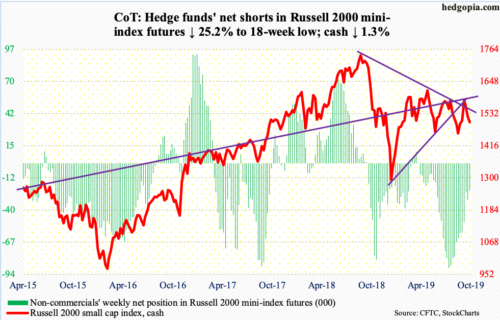
Thursday’s intraday low of 1462.22 just about tested two-year support at 1450s. This level was defended in early June and several more times in August. Once again, small-cap bulls stepped up to the plate, although this preceded significant downward pressure that began mid-September. On the 16th last month, the cash (1500.28) rallied to 1590.50 intraday before retreating. Resistance just north of 1600 goes back to January last year. The underside of a broken trend line from last December draws to 1600 as well.
Nearest resistance lies at 1520s, where the 50- and 200-day are converging (1520.68 and 1522.56 respectively).
In the week to Wednesday, $1.5 billion and $350 million came out of IWM (iShares Russell 2000 ETF) and IJR (iShares Core S&P Small-Cap ETF) respectively (courtesy of ETF.com).
US Dollar Index: Currently net long 43k, up 1.1k.
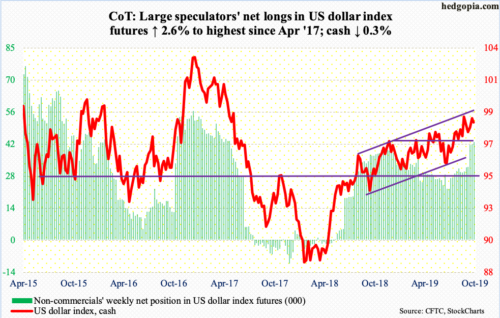
Tuesday, the cash (98.49) came within 0.02 of the September 3rd high of 99.33. Back then, it was repelled at the upper bound of a one-year rising channel. This resistance now lies at 99.50s. But bulls first have to take out the September high before that happens.
On the daily, there is room for the US dollar index to continue lower. The 50-day is at 98.11. More important is what transpires at 97.50s, which has seen a lot of bull-bear tug of war for 11 months now.
VIX: Currently net short 154.9k, up 6.3k.
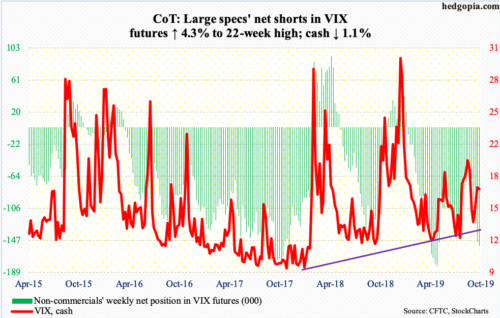
Volatility jumped this week but in a restrained manner. Wednesday’s intraday high of 21.46 was the highest since August 28. Early that month, the cash (17.04) spiked to 24.81 before retreating. Thursday, VIX again jumped to 21.44 but only to pull back and end the session at 19.12, resulting in a spike reversal.


